Tag Archives: bullish-bearish

Will Yellen Move The Price Of SLV?

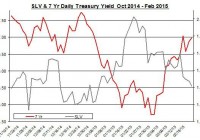
Summary The price of SLV fell down in the past week. Will Yellen’s testimony move the price of SLV? The rally in the U.S. treasury yields coincided with the drop in silver prices. The silver market cooled down in the past week as shares of the iShares Silver Trust ETF (NYSEARCA: SLV ) fell by 6%. For SLV, the upcoming testimony of Yellen and the latest developments in Europe could curb further down SLV. Yellen testifies Following the release of the minutes of the FOMC meeting, the upcoming testimony of FOMC Chair Yellen will take the center stage this week. Yellen will testify on Tuesday and Wednesday before the Senate Banking Committee and House Financial Services Committee, respectively. The latest minutes were perceived a bit dovish. After all, the probabilities of a rate hike have gone down a bit for both July and June compared to previous weeks. Because of the dovish tone in the minutes, some market analysts think that Yellen’s testimony will be a bit more hawkish – given the strong numbers presented in the latest non-farm payroll report, this scenario is plausible. But Yellen isn’t likely to rock the boat and reiterate that a decision on a rate hike will be data dependent. Since the FOMC is slowly adjusting the markets for a rate hike in the coming months, it’s unlikely that there will be a surprise or significant delay. This is true because central banks tend to “surprise the markets” and change the market expectations when it comes to stimulating the economy. When it comes to austerity and rate hikes, central banks tend to be much more cautious, prudent and give enough time for the market to adjust to the new policy. The biggest fear of a central bank is that its policy change will lead to an economic slowdown or even recession. Besides Yellen’s testimony, the second estimate of the U.S. GDP for the fourth quarter will be released on Friday. In the first estimate, the GDP growth rate was 2.6%, which was a bit lower than market expectations. If the GDP growth rate comes lower than current estimates, which are 2.1%, this news may bring back up the price of SLV. Another report worth considering is the U.S. CPI, which will be released this week. A drop in the core CPI could actually bring up SLV – this could revise down the FOMC’s inflation expectations. In the meantime, the recent developments in Europe may have also contributed to the weakness of SLV. Greece’s debt problem was defused, for now… One factor that could have had some indirect implications on the levels of risk in the financial markets, which may have benefited precious metals investments such as SLV, is the Greek debt problem and the possibility of a Greek exit from the European Union. The recent news from this front is that the Greeks have practically conceded to the Germans : The Greeks didn’t achieve too major goals to the austerity measures set in place. Greece received a four-month extension on its bailout. In exchange, on Monday, the Syriza-led government submitted its list of structural reforms that will need to be approved by the EU members. At least when it comes to the fiscal targets, the Greeks got a victory, and the budget surplus of 4.5% of GDP is on the table and the target could come down to 1.5% next year. These developments are likely to push away the whole Greek exit talk for the near term from the markets’ agenda. One of the main events of the week in Europe is the third tranche of the targeted LTRO. The last two auctions came short of market expectations. If this tranche also fails to reach high levels, then it could suggest the ECB may wish to expand its QE program. For SLV, lower risk in the financial markets could bring further down its price. One way is via the changes in the U.S. treasury yields. The sharp fall in U.S. long-term treasury yields at the beginning of the year changed course in recent weeks, as indicated in the chart below. Source: U.S. Department of Treasury and Bloomberg The linear correlation between SLV and U.S. long-term treasury yields isn’t strong at only -0.17 (for 7-year yields), but precious metals, especially gold, tend to have a strong relation with treasury yields. Nonetheless, the rise in U.S. interest rates, as the market expects a rise in the Fed’s cash rate in the middle of the year, could further contribute to the weakness of SLV. In the past week, the amount of silver ounces in SLV has picked up a bit albeit the silver ounces in this ETF are still down for the year. Source: iShares Silver Trust website It’s still unclear when, if at all, the FOMC starts to raise rates. For now, it seems that unless we will see a major change in the U.S. economic recovery, the FOMC will likely to raise rates in the middle of the year. Yellen’s upcoming testimony could provide some more insight about the next policy change, but I suspect this testimony, much like others in the past, won’t offer more than a general tone and “data dependency” policy. The recent diffusion of the Greek debt crisis is likely to curb down the demand for investments that are considered safe haven such as precious metals. For now, the possible upside for SLV is if the U.S. economy’s progress fails to meet market expectations (e.g. lower-than-anticipated growth in GDP or CPI). In such an event, SLV could rally, even if for a short term. For more see: Will Higher Physical Demand For Silver Drive Up SLV? Disclosure: The author has no positions in any stocks mentioned, and no plans to initiate any positions within the next 72 hours. (More…) The author wrote this article themselves, and it expresses their own opinions. The author is not receiving compensation for it (other than from Seeking Alpha). The author has no business relationship with any company whose stock is mentioned in this article.

Keep LatAm At A Distance – Overweight Emerging Asia

I sense a strong desire to buy LatAm given valuations. I would restrain that desire though. While Asia’s earnings are growing, LatAm’s are still in recession terrain. Investors are overweight LatAm over Asia still. A contrarian view will suit investors well. LatAm’s weighting has been reduced substantially among emerging markets to a low of 15% ( Figure 1 ). This is the lowest level since 1990. Some would suggest overweighting LatAm (NYSEARCA: ILF ) vs. Asia (NYSEARCA: GMF ). I disagree, and LatAm remains my largest underweight. (click to enlarge) The time for recovery will arrive for EMEA (NASDAQ: EEME ) and LatAm, but not yet (see figures 2 and 3). Earnings wise, LatAm and EMEA remain in recession. When you buy a stock, you end up buying an earnings story, not GDP. LatAm earnings are 47% below their pre-financial crisis high, and earnings in USD terms are lower than their financial crisis low. EMEA earnings in USD terms are above their financial crisis low but just barely. Only Asia earnings have continued making new highs. (click to enlarge) Source: Bloomberg Terminal Now, you might argue that a low base lends itself to a powerful rebound, however, as I will further explain, this is not the case. As you can see in Figure 4 , beneficiaries from commodity prices should experience a margin lift from lower input costs while LatAm should suffer from worsening terms of trade. Some countries in EMEA win and some lose, so it’s less clear there. Russia is a loser (NYSEARCA: RSX ). Turkey gains on trade, but loses on the capital account side (NYSEARCA: TUR ). And that leaves South Africa which benefits through the trade balance (NYSEARCA: EZA ). (click to enlarge) In LatAm, commodity income represents 30%, and 60% in EMEA. In Asia, commodities represent only 14% of net income and most of that comes from processors and not extractors. EPS revisions are improving in the case of Asia, but worsening in EMEA and LatAm. Investors should ideally like stocks and markets with improving EPS revisions and shun those with deteriorating conditions. Trailing price-to-earnings ratios for Asia are one standard deviation below average. For EMEA, this number stands at mean, and for LatAm, the P/E is one standard deviation above the mean. Implied EPS growth rate for Asia, EMEA and LatAm are 2.1%, 3.4% and 4.5%, respectively. This means that both EMEA and LatAm need to grow at higher rates in order to justify their valuations. The same story is echoed by the price-to-book. The only measure that would put LatAm on top is the CAPE, however, the CAPE is very dependent on past performance repeating itself in the future, and with low commodity prices, CAPE is a bit out of sync in my opinion. Lower commodity prices, as I mentioned, should hinder energy exporters while benefiting importers as terms of trade are improving for importer countries. Another factor is current account deficits. Mexico (NYSEARCA: EWW ) will most probably follow the Federal Reserve higher, and Brazil’s (NYSEARCA: EWZ ) rates should also increase. Normally, this wouldn’t impact emerging market equities as historically equities have increased after the first Fed rate hike, as a hike usually means growth is returning. However, current account deficits with higher interest rates are not an optimal combination, which should put a limit in stock market price appreciation. If you divide countries with current account surplus vis-a-vis deficit and evaluate how they’ve reacted after the hike, one can evidence a strong divergence between countries with different CA situations ( see Figure 5 ). Asia mostly maintains current account surpluses. This should help maintain Asian equities. (click to enlarge) Investors are still overweight LatAm over Asia based on 60 EM funds ( see Figure 6 ), and this should provide a buying opportunity. A time should arrive when being a contrarian will not be the way to go, however, that time is not here yet. (click to enlarge) I would personally use the SPDR S&P Emerging Asia Pacific ETF to invest in the region. The expense ratio is .49% and 1-year performance ending 01/31/15 was 18.77%. Here is a chart of LTM. A picture says more than a thousand words. GMF data by YCharts Disclosure: The author has no positions in any stocks mentioned, and no plans to initiate any positions within the next 72 hours. (More…) The author wrote this article themselves, and it expresses their own opinions. The author is not receiving compensation for it (other than from Seeking Alpha). The author has no business relationship with any company whose stock is mentioned in this article.

Own The Strongest Dividend Growers With This ETF

Summary Dividend aristocrats, or blue-chip companies that consistently raise their dividends, tend to outperform the broader market over long periods. Dividend increases are positive predictors of future corporate performance. Dividend aristocrats are unique due to the fact that most companies are unable to increase dividends when facing business cycle downturns and capital market shocks. By offering consistently increasing payouts on a long-term basis, dividend aristocrats act as a hedge against economic uncertainty and provide downside portfolio protection. Dividend aristocrats, or blue-chip companies that consistently raise their dividends , tend to outperform the broader market over long periods. To be considered a dividend aristocrat, a company must typically have raised its dividend for at least 25 consecutive years. Dividend aristocrats are unique due to the fact that most companies are simply unable to continually boost dividend payouts when facing business cycle downturns and capital market shocks. Dividend increases are positive predictors of future corporate performance. By offering consistently increasing payouts on a long-term basis, dividend aristocrats act as a hedge against economic uncertainty and provide downside portfolio protection. The ProShares S&P 500 Dividend Aristocrats ETF (NYSEARCA: NOBL ) tracks the S&P 500 Dividend Aristocrats Index, which only includes companies that (1) are members of the S&P 500 and (2) have increased their dividends for at least 25 consecutive years . If an existing member cuts, or even freezes its dividend, it is dropped from the index. Rebalancing takes place quarterly with an annual reconstitution, taking place during the January rebalance. Only the very best dividend payers are permitted to remain in this elite club. (click to enlarge) What should excite you about NOBL is the fact that the vast majority of companies that comprise this ETF have raised their dividends during some tough times, including the financial crisis of 2008. I don’t know about you, but I find this kind of financial strength and predictability intoxicating, in fact, almost irresistible. The 53 companies in this ETF are equally weighted and they’re diversified across a variety of sectors, such as consumer staples, consumer discretionary, industrials, materials, and many others. Unlike many dividend-oriented ETFs, NOBL does not have the majority of its exposure in financial, telecom or utility stocks, which makes it especially attractive, considering how poorly these stocks perform in a rising interest rate environment. Sector weights are capped at 30% each. NOBL’s current dividend yield is 1.60% and its annual expense ratio is just 35 basis points. An abundance of historical data going back to 2005, when Standard & Poor’s first constructed the S&P 500 Dividend Aristocrats Index, confirms its superior performance over the S&P 500. Over the past 12 months, the S&P 500 Dividend Aristocrats ETF has produced a total return of 17.82% vs. 14.92% for the SPDR S&P 500 Trust ETF (NYSEARCA: SPY ): (click to enlarge) Conclusion The S&P 500 Dividend Aristocrats Index is made up of some of the highest-quality, income-producing stocks available to investors today. Even if you are a risk-averse investor, you may still find NOBL to be an attractive core holding since it’s comprised of companies with stable earnings which produce less volatile returns. NOBL held up better than the S&P 500 during the last bear market. The Aristocrats Index lost -22% during the 2008 financial crisis while the S&P 500 Index fell -37%. NOBL, since late January, is outperforming many “defensive” funds, most of which typically hold utility companies. The Dow Jones Utility Average (DJUA) peaked on January 29th at 652. Now at 600, the DJUA has lost -8% while NOBL has gained +3%. Another potential benefit, because of NOBL’s very small exposure to the Utility sector, would likely be outperformance over most other dividend-paying funds in a rising interest rate environment . You may not be aware of the fact that the 10-year Treasury bond has risen from 1.67% to 2.11% since February 2nd. This move may be a prelude of what’s to come this year. So, bottom line, it may be time to “overweight” NOBL in your investment portfolio. Consider replacing the plain vanilla S&P 500 fund and potentially other “defensive” equity funds in your portfolio with NOBL to enjoy the consistent dividend-paying and defensive attributes of this elite ETF. Additional disclosure: George Kiraly Jr., CFP, MBA is the president of LodeStar Advisory Group, LLC, an independent Registered Investment Adviser located in Short Hills, New Jersey. George Kiraly, LodeStar Advisory Group, and/or its clients may hold positions in the ETFs, mutual funds and/or any investment asset mentioned above. The opinions offered herein are not personalized recommendations to buy, sell or hold securities. Disclosure: The author is long NOBL. (More…) The author wrote this article themselves, and it expresses their own opinions. The author is not receiving compensation for it. The author has no business relationship with any company whose stock is mentioned in this article.