Tag Archives: investing ideas

Active Power Inc: ‘Disruptive Technology’ Not So Revolutionary After All
Summary Flywheel technology has been much hyped as the next big thing in the UPS space, although batteries have prevailed as the dominant solution. Wider market acceptance of flywheel technology would not necessarily result in upside, due too immense competition in a business where reliability and economics of scale are key. Significant loss of market share on a relative and absolute basis invalidates the bull thesis. Rapidly deteriorating financials in the most recent years suggests that their competitive situation has only become worse. 3x book value for a company that has never been profitable and has a declining top-line is just too much, a market cap at liquidation value is more appropriate. The first impression one gets from reading all the information on Active Power, Inc.(NASDAQ: ACPW )’ website is one of a business with a great product that is at the cusp of gaining market acceptance, as soon as these darn datacenter-architects would finally realize the benefits of flywheel-technology. They make a compelling case, where it not for the fact that: The technology is about 20 years old and market acceptance would surely have already taken place if the product really were superior. Rather than being a scrappy start-up, the company is a tiny player in a relatively mature industry, where long-term customer relations and scale are key. While touting their product’s perceived benefits they basically conceded that it’s not working out by offering the same product utilizing legacy technology Active Power Inc. builds so-called Uninterrupted Power Supplies (UPS). A UPS is an electrical apparatus that provides emergency power to a load when the main power source fails. A UPS differs from an auxiliary or emergency power system or standby generator in that it will provide near-instantaneous protection from input power interruptions, by supplying energy stored in batteries, supercapacitors, or flywheels. The on-battery runtime of most uninterruptible power sources is relatively short (only a few minutes) but sufficient to start a standby power source or properly shut down the protected equipment. In essence, they serve to bridge the time-gap between the occurrence of a power-outage and the start-up of a backup generator. It is a typical value-add business, with the overall addressable market estimated to be in the area of ~17B, with the sub segment of relatively large scale UPS with more than 150 kVA, the market that Active Power is targeting, around 4.6B. Most of these UPS’ utilize batteries to store energy. Active Power’s UPS’ on the other hand use flywheel technology. Instead of storing chemical energy, like batteries do, flywheels are brought to spin very fast, storing kinetic energy in the process, which can then be converted to electrical energy if need be. The bull thesis in essence, is that flywheel UPS’s While having larger upfront costs, have lower lifetime costs, as the maintenance intervals are larger; Are “greener” compared to batteries, as the latter end up being toxic waste; While runtime lies in the area of 10-15 seconds for flywheel UPS, compared to ~15 minutes for battery UPS, usually only a few seconds would be needed until the backup generator comes on-line. Combined these factors would make the market gradually shift to flywheel technology. Back in reality, the company, which has been in business for 15 years and never made a profit, saw a shrinking top line. (click to enlarge) Source: Morningstar In their 2010 10-K they state that their addressable market at the time was in the area of ~1.8B, compared to 4.6B in 2014. Using their revenue numbers in these years implies that their market share has actually dropped from around 3.6% in 2010 to 1% in 2014. This certainly doesn’t support the bull thesis, although market statistics on UPS are scarce, and it’s unclear how much of this is attributable to flywheel UPS gaining (or losing) traction or if the company plainly can’t compete. The UPS market is highly concentrated, with the bulk of the market share lying with Schneider-Electric (OTCPK: SBGSF ) and Emerson (NYSE: EMR ), both 40B market-cap behemoths. (click to enlarge) Source: VDC research The scrappy up-start picture isn’t supported by the fact that both of these companies massively invested in flywheel UPS themselves, With Schneider-Electric having bought APC, the until then US-market leader in the UPS market and Emerson’s acquisition of Liebert. Both of these subsidiaries offered extensive flywheel UPS products . Though Emerson at some point in the recent past opted to discontinue their flywheel product line, suggesting that the flywheel sub segment may be even more concentrated with Schneider Electric than the overall UPS market. Bottom line, these findings are still ambivalent as to whether the flywheel technology has gained traction in the market, but the significant reduction in market share AND absolute sales suggests a severe competitive disadvantage in a market that has more than doubled in the past four years. If one chooses to buy one of these, one wants to be really sure it will work. The lifetime of UPS are in the area of 15-20 years, and incur significant recurring service costs and warranty coverage. The slightly lower life time costs of flywheel UPS compared to UPS cost is simply a negligible criteria for customers compared to the vendors ability and reputation to service their products regularly and guarantee warranty coverage. Source: VDC research In the case of Active Power, there is substantial uncertainty as to whether the company will even be around in 10 years time, which greatly reduces their value proposition vs their peers. Bigger is simply better in this market. Financials As stated before, the company has never made a profit during it’s lifetime. In the most recent years it has additionally seen rapidly deteriorating operating margins as seen below: (click to enlarge) Source: Morningstar Yet they publish slides like this titles “gaining momentum”: (click to enlarge) witness the momentum To stay afloat, they regularly dilute their share count every 2 years: (click to enlarge) Source: Morningstar In spite of rapidly deteriorating financials, massive loss of market share on a relative and absolute basis in a market that has seen huge growth and severe competitive disadvantages versus their large peers that offer a substantially better value proposition, the company still trades at 3x book value, with a market cap of around $50M. My best guess as to why this is the case, is that they make a good case to the investing world of their superior product and tell a good story of how the break-out is right around the corner. The facts however tell the opposite story. Most of their assets are in the form of current assets, which makes their book value a decent proxy for liquidation value, a more appropriate yardstick of what this company should be trading for, implying 60% downside. I’ve used several sources throughout this analysis, most notably the 10-K’s of Active Power Inc, Schneider Electric and Emerson, as well as some research papers on the flywheel vs battery UPS debate from Mitsubishi , Schneider , datacenter dynamics and VDC research . Financial data was taken from Morningstar. Editor’s Note: This article covers one or more stocks trading at less than $1 per share and/or with less than a $100 million market cap. Please be aware of the risks associated with these stocks. Disclosure: The author has no positions in any stocks mentioned, and no plans to initiate any positions within the next 72 hours. (More…) The author wrote this article themselves, and it expresses their own opinions. The author is not receiving compensation for it (other than from Seeking Alpha). The author has no business relationship with any company whose stock is mentioned in this article.
Will Yellen Move The Price Of SLV?

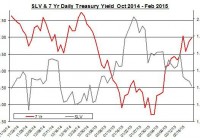
Summary The price of SLV fell down in the past week. Will Yellen’s testimony move the price of SLV? The rally in the U.S. treasury yields coincided with the drop in silver prices. The silver market cooled down in the past week as shares of the iShares Silver Trust ETF (NYSEARCA: SLV ) fell by 6%. For SLV, the upcoming testimony of Yellen and the latest developments in Europe could curb further down SLV. Yellen testifies Following the release of the minutes of the FOMC meeting, the upcoming testimony of FOMC Chair Yellen will take the center stage this week. Yellen will testify on Tuesday and Wednesday before the Senate Banking Committee and House Financial Services Committee, respectively. The latest minutes were perceived a bit dovish. After all, the probabilities of a rate hike have gone down a bit for both July and June compared to previous weeks. Because of the dovish tone in the minutes, some market analysts think that Yellen’s testimony will be a bit more hawkish – given the strong numbers presented in the latest non-farm payroll report, this scenario is plausible. But Yellen isn’t likely to rock the boat and reiterate that a decision on a rate hike will be data dependent. Since the FOMC is slowly adjusting the markets for a rate hike in the coming months, it’s unlikely that there will be a surprise or significant delay. This is true because central banks tend to “surprise the markets” and change the market expectations when it comes to stimulating the economy. When it comes to austerity and rate hikes, central banks tend to be much more cautious, prudent and give enough time for the market to adjust to the new policy. The biggest fear of a central bank is that its policy change will lead to an economic slowdown or even recession. Besides Yellen’s testimony, the second estimate of the U.S. GDP for the fourth quarter will be released on Friday. In the first estimate, the GDP growth rate was 2.6%, which was a bit lower than market expectations. If the GDP growth rate comes lower than current estimates, which are 2.1%, this news may bring back up the price of SLV. Another report worth considering is the U.S. CPI, which will be released this week. A drop in the core CPI could actually bring up SLV – this could revise down the FOMC’s inflation expectations. In the meantime, the recent developments in Europe may have also contributed to the weakness of SLV. Greece’s debt problem was defused, for now… One factor that could have had some indirect implications on the levels of risk in the financial markets, which may have benefited precious metals investments such as SLV, is the Greek debt problem and the possibility of a Greek exit from the European Union. The recent news from this front is that the Greeks have practically conceded to the Germans : The Greeks didn’t achieve too major goals to the austerity measures set in place. Greece received a four-month extension on its bailout. In exchange, on Monday, the Syriza-led government submitted its list of structural reforms that will need to be approved by the EU members. At least when it comes to the fiscal targets, the Greeks got a victory, and the budget surplus of 4.5% of GDP is on the table and the target could come down to 1.5% next year. These developments are likely to push away the whole Greek exit talk for the near term from the markets’ agenda. One of the main events of the week in Europe is the third tranche of the targeted LTRO. The last two auctions came short of market expectations. If this tranche also fails to reach high levels, then it could suggest the ECB may wish to expand its QE program. For SLV, lower risk in the financial markets could bring further down its price. One way is via the changes in the U.S. treasury yields. The sharp fall in U.S. long-term treasury yields at the beginning of the year changed course in recent weeks, as indicated in the chart below. Source: U.S. Department of Treasury and Bloomberg The linear correlation between SLV and U.S. long-term treasury yields isn’t strong at only -0.17 (for 7-year yields), but precious metals, especially gold, tend to have a strong relation with treasury yields. Nonetheless, the rise in U.S. interest rates, as the market expects a rise in the Fed’s cash rate in the middle of the year, could further contribute to the weakness of SLV. In the past week, the amount of silver ounces in SLV has picked up a bit albeit the silver ounces in this ETF are still down for the year. Source: iShares Silver Trust website It’s still unclear when, if at all, the FOMC starts to raise rates. For now, it seems that unless we will see a major change in the U.S. economic recovery, the FOMC will likely to raise rates in the middle of the year. Yellen’s upcoming testimony could provide some more insight about the next policy change, but I suspect this testimony, much like others in the past, won’t offer more than a general tone and “data dependency” policy. The recent diffusion of the Greek debt crisis is likely to curb down the demand for investments that are considered safe haven such as precious metals. For now, the possible upside for SLV is if the U.S. economy’s progress fails to meet market expectations (e.g. lower-than-anticipated growth in GDP or CPI). In such an event, SLV could rally, even if for a short term. For more see: Will Higher Physical Demand For Silver Drive Up SLV? Disclosure: The author has no positions in any stocks mentioned, and no plans to initiate any positions within the next 72 hours. (More…) The author wrote this article themselves, and it expresses their own opinions. The author is not receiving compensation for it (other than from Seeking Alpha). The author has no business relationship with any company whose stock is mentioned in this article.

Estimating Worst Case SWRs For Modern Portfolios

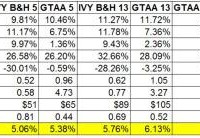
One of the challenges in dealing with modern portfolios like the Permanent Portfolio, the various IVY portfolios, Risk Parity portfolios, etc is the lack of long term historical data. Most of the modern portfolio data for a broad range of asset classes only goes back to 1973. The period from 1973 onward obviously only represents a subset of historical economic and financial conditions. This represents quite a challenge when looking forward and trying to model probable future outcomes for different portfolios. In the context of retirement this fact makes determining SWRs for modern portfolios difficult. The worst case historical 30 year retirement period that determines the SWR for the 60/40 US stock US bond portfolio began in 1966 . Fortunately, 1966 is not that far from 1973 which gave me an idea for estimating SWRs for modern portfolios as if they existed from 1966. Just use the 60/40 return data to for the modern portfolios from 1966 to 1972, then the modern portfolio return data going forward to estimate an SWR for these portfolios. This should give a conservative estimate for historical SWRs form these portfolios which is an apples to apples comparison to the SWR from the classic 60/40 portfolio, aka the famous 4% rule. Let’s see where this process takes us. In previous posts I had presented a variety of statistics for modern portfolios; returns, standard deviations, and SWRs. I also pointed out that the SWRs from these calculations had to be taken with a huge grain of salt. The retirement periods from 1973 onward, when the data for the modern portfolios begins, do not encompass the worst case period in history to retire, the 30 year period starting in 1966. The SWRs for periods starting in 1973 would be significantly higher than for those starting in 1966. In order to get an estimate of what SWRs for modern portfolios would have been going back to 1966 I simply took the historical return series for each of the modern portfolios and used the return data from the 60/40 portfolio from 1966 to 1972 for each portfolio. This will yield a conservative estimate of the modern portfolio SWRs going back to 1996. The assumption here of course is that the modern portfolios would have performed better than the 60/40 portfolios from 1966 to 1972. I think that’s a pretty safe assumption. Below is a table of the results along with the other portfolios stats that I updated through 2014. I did not do this exercise for all the portfolios I track just the ones I discuss the most often on the blog. First, all the portfolio stats in the table are for the period from 1973 to 2014, the actual performance of the portfolios. It is only for estimating the SWRs that I inserted the 1966 to 1972 60/40 return data. I labeled that line 1966 SWRs to make that distinction. As the 1966 SWR line shows, even with the initial 7 year (1966 to 1972) equal performance to the 6o/40 portfolio all of modern portfolios have significantly higher SWRs than the classic 60/40 or even 70/30 US stock US bond buy and hold portfolio. The more broadly diversified buy and hold portfolios, IVY B&H 5, IBY B&H 13, and the Permanent Portfolios have estimated 1966 SWRs ranging from 5.06% to 5.76%. The portfolios that add simple downside risk management (via the 10 month SMA) – the GTAA5 and GTAA 13 portfolios have 1966 SWRs of 5.36% and 6.13% respectively. GTAA 13 also adds value and momentum factors to the mix. Then the portfolios that have diversification, downside risk management, value and dual momentum factors have the highest 1966 SWRs of all. The Antonacci dual momentum portfolios, GEM and GBM, have 1966 SWRs of 5.71% and 5.68%. The aggressive IVY momentum portfolios, AGG6 and AGG3 lead the bunch with SWRs of 7.95% and 8.63% respectively. Pretty impressive all the way around even after handicapping the modern portfolios with 60/40 returns from 1966 to 1972. In summary, modern portfolios have significantly higher SWRs than the classic 4% SWR rule suggests. Even in the forecasted poor return scenarios that I’ve discussed before these portfolios will most likely perform much better than the classic portfolio that the original 4% SWR was based on. Does that mean that these estimated historical SWRs can be used for investors starting to withdraw from portfolios today? Possibly but I wouldn’t go so far as that. As the infamous disclaimer goes, past returns are no guarantee of the future. All we can do is put the odds in our favor. Being the conservative sort, I base my investment allocations on one or more of these modern portfolios but still stick the 4% SWR rule. Then I adjust SWRs accordingly maybe every 3-5 years. Regardless, the superior nature of the modern portfolios, not just in terms of SWRs, should be considered by all investors. Note: There is a lot of information about modern portfolios to glean from all of the portfolio stats in the above table for investors withdrawing from portfolios and even of investors still in the wealth building phase. Just look at the differences in returns/risk and long term wealth for these modern portfolios vs the most often recommended 60/40 buy and hold portfolio. The fact that the 60/40 portfolio is still the most common allocation for US investors is kind of crazy when you see these results.