Tag Archives: investing ideas

SCHE: Avoiding China Is The Key To Improving Risk Adjusted Returns
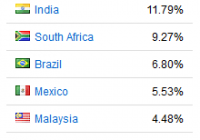
Summary The Chinese market looks very dangerous and that risk could severely damage SCHE for allocating 28% of equity to Chinese securities. The level of education attained by a new wave of domestic investors in China should be shocking. The only thing more bearish than investors buying securities they don’t understand is those same investors on margin. Driving the potential for a correction to come sooner rather than later is the potential for new regulations restricting margin trading. If the bubble pops, retail investors in China may face dramatic losses that would prevent them from buying goods and services. My international exposure comes from two ETFs. I’m holding the Vanguard Global Ex-U.S. Real Estate Index ETF (NASDAQ: VNQI ) and the Schwab International Equity ETF (NYSEARCA: SCHF ). In my opinion, SCHF is dramatically better positioned than the Schwab Emerging Markets Equity ETF (NYSEARCA: SCHE ). My perspective favoring SCHF is tied to the enormous position that SCHE is holding in Chinese equities. It is my belief that SCHE may have some substantial volatility and may face significantly worse performance over the next few years due to the large position in Chinese equities. The table below shows the strong allocation to China in SCHE. Why I’m bearish on China The Chinese market has been on fire hitting one high after another. I wasn’t bearish on the Chinese equity market before the valuations soared, but I’m not a fan of higher prices or the lack of fundamentals driving the growth in valuations. That sure sounds like a bubble I’d like to share an excerpt from the International Business Times . These are the kind of warnings that can easily be swept under the rug when investors are chasing the potential for huge returns. One resident, Liu Lianguo, told the channel that playing mahjong, the residents’ former spare time occupation, might lead people astray, into a life of gambling — whereas the government was ‘encouraging us to invest in the stock market.’ Some villagers were reported to have earned tens of thousands of U.S. dollars in just a few weeks. And with stories of students investing in shares, and a wave of novels about playing the markets now attracting readers, it’s no wonder that one Dragon TV news presenter said this week that, “if you’re not frying shares at the moment you feel embarrassed to talk to people, you don’t know what to talk about.” Remember that the domestic Chinese equity market is dominated by A-shares which have been restricted from foreign investment and which were previously very difficult for investors to short. The combination of a closed market, difficulty initiating shorts, and investors with more leverage than education is a recipe for disaster. It may sound like I’m being cruel when I suggest that investments are being fueled by those with low education, but I’m referencing data coming out of China. A survey of “New Investor Households” indicated that there was a substantial growth in investments made by people with less education. (click to enlarge) I’m going to be bearish whenever I see an enormous volume of investors without substantial training. How many people do you know with a Bachelor’s degree that you wouldn’t trust to change your oil? In my opinion, one of the biggest signs for a bubble is when people are investing without knowing what they are doing. Buying on margin If there is one thing that concerns me more than naive investors, it is naïve investors on margin. In 2010 the government opened up to trading on margin. The Wall Street Journal reports that Chinese regulators are amending rules on margin-trading. If margin trading is severely restricted, it could trigger the kind of selling events that would force other traders into margin calls and trigger more selling events. Euphoria combined with margins is a recipe for disaster, and I don’t have room for more disaster in my portfolio. I already have Freeport-McMoRan (NYSE: FCX ), so I’m pretty much full on disasters. Conclusion The investments in China are becoming more dangerous as the potential for a major correction heats up. Even if share price levels can be justified by fundamental analysis, a restriction on margins could create the collapse that would prevent Chinese investors from being Chinese consumers. If the domestic investors lose their shirts in the correction, the drop should be dramatic because the sales prospects and earnings potential of the companies should fall because their customers will be financially ruined by the loss on margins. My strategy is to stick to international investments that are underweight on China. My shares of VNQI have some exposure to China, with 8.28% of holdings in China. That’s about as much exposure to China as I want to stomach at this point. When I’m adding to my international holdings I’ll be using SCHF instead of VNQI to prevent China from gaining further exposure in my portfolio. I’m completely avoiding shares of SCHE because of the enormous exposure to China. In a nutshell: Sell SCHE to buy SCHF Disclosure: The author is long SCHF, VNQI. (More…) The author wrote this article themselves, and it expresses their own opinions. The author is not receiving compensation for it (other than from Seeking Alpha). The author has no business relationship with any company whose stock is mentioned in this article. Additional disclosure: Information in this article represents the opinion of the analyst. All statements are represented as opinions, rather than facts, and should not be construed as advice to buy or sell a security. Ratings of “outperform” and “underperform” reflect the analyst’s estimation of a divergence between the market value for a security and the price that would be appropriate given the potential for risks and returns relative to other securities. The analyst does not know your particular objectives for returns or constraints upon investing. All investors are encouraged to do their own research before making any investment decision. Information is regularly obtained from Yahoo Finance, Google Finance, and SEC Database. If Yahoo, Google, or the SEC database contained faulty or old information it could be incorporated into my analysis.
Bargain Energy Funds To Buy As Crude Shows Uptrend

There aren’t many individuals who don’t like a good bargain. Most, or perhaps everyone, loves a great deal and such a bargain is now available in the energy sector. After the rout in crude prices last year, prices have stabilized, and crude is now gaining ground, making the sector a safer investment option. The fundamentals driving the price of the commodity look good, and thus buying energy funds at the current discount would be a prudent move. The word “downturn” fits perfectly for the energy sector. Crude prices had slumped to below $50 a barrel. Thus, the profit margins of several players from the industry have seen massive declines. This has hit stock prices as well. Nevertheless, this has made their stocks inexpensive and a really good bargain. Funds with strong fundamentals owning potential gainers from the energy sector should do well going forward, somewhat illustrated by their year-to-date gains. Before we cherry pick the energy funds, let’s look at other details. Fundamentals Driving Crude Since last June – when oil was trading around $100 per barrel – we saw a prolonged plunge in crude. This was primarily owing to the plentiful North American shale supplies when nobody seemed interested in buying, sluggish growth in China, and a dull European economy. However, the fundamentals are improving now. U.S. Energy Department’s weekly inventory release showed that crude stockpiles fell for the fifth straight week despite domestic production notching up to another record. The federal government’s EIA report revealed that crude inventories fell by 1.95 million barrels for the week ending May 29, 2015, following a decrease of 2.80 million barrels in the previous week. But the real booster should be felt on the demand side. The peak summer driving season in the U.S. – started officially this past Memorial Day weekend – and should fuel up crude consumption. According to the American Automobile Association (AAA) and IHS Global Insight, about 37.2 million travelers were forecasted to have traveled by air and road during the Memorial Day weekend. If the prediction is to be believed, then this Memorial Day weekend might have been the busiest in a decade, with the highest travel volume since 2005. Moreover, we have seen Asian demand for crude increasing. As per Energy Aspects – an independent research consultancy firm in U.K. – notwithstanding a slowing economy in China, the country’s crude import touched a record 7.4 million barrels per day in April. Additionally, according to the Ministry of Finance, customs-cleared oil imports in Japan hiked 9.1% from last April to 3.62 million barrels per day in April 2015. The improving fundamentals – as reflected in growing demand and lower supply – are reflected in the recent West Texas Intermediate (WTI) crude price of $59.72 per barrel, up significantly from the six-year low mark of $43.88 per barrel in March 2015. 3 Energy Mutual Funds to Buy Here we will list 3 Energy mutual funds that either carry a Zacks Mutual Fund Rank #1 (Strong Buy) or Zacks Mutual Fund Rank #2 (Buy). Remember, the goal of the Zacks Mutual Fund Rank is to guide investors to identify potential winners and losers. Unlike most of the fund-rating systems, the Zacks Mutual Fund Rank is not just focused on past performance, but the likely future success of the fund. The following funds are rebounding from 1-year loss and have encouraging year-to-date gains. Fidelity Select Energy Portfolio (MUTF: FSENX ) seeks capital growth over the long run. FSENX invests a lion’s share of its assets in companies involved in the energy sector including oil, gas, electricity, and solar power. FSENX primarily focuses on acquiring common stocks of companies throughout the globe. Factors such as financial strength and economic condition are considered before investing in a company. FSENX currently carries a Zacks Mutual Fund Rank #1. Its year-to-date gain is 8.8% as against 12.3% decline over 1-year period. The 3- and 5-year annualized returns stand at 7.9% and 8.5%. The annual expense ratio is 0.79% as compared to category average of 1.44%. FSENX carries no sales load. Guinness Atkinson Alternative Energy (MUTF: GAAEX ) seeks capital growth over the long term. GAAEX invests heavily in domestic and foreign companies from the alternative energy sector. GAAEX invests in companies regardless of their market capitalization and may also invest in developing economies. GAAEX currently carries a Zacks Mutual Fund Rank #2. Its year-to-date gain is 11.7% as against 7.1% decline over 1-year period. The 3-year annualized return stands at 16.7%. The annual expense ratio of 1.98% is, however, higher than the category average of 1.44%. GAAEX carries no sales load. Fidelity Advisor Energy T (MUTF: FAGNX ) invests in common stocks and in certain precious metals. The fund normally invests at least 80% of assets in securities of companies principally engaged in owning or developing natural resources, or supply goods and services to such companies, or in physical commodities. FAGNX currently carries a Zacks Mutual Fund Rank #1. Its year-to-date gain is 8.7% as against 12.6% decline over 1-year period. The 3- and 5-year annualized returns stand at 6.1% and 6.4%. The annual expense ratio is 1.34% as compared to category average of 1.44%. Original Post

Using Profitability As A Factor? Perhaps You Should Think Twice…

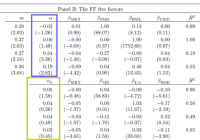
By Wesley R. Gray, Ph.D. Many investors are getting excited about the so-called ” profitability factor ,” originally posed by Novy-Marx (here is an alternative story ). Larry Swedroe has a high-level piece advocating the concept here . The basic idea is simple: Other things being equal, firms with high gross profits (revenue – costs) have earned higher expected returns than firms with low gross profits. Even market heavyweights Eugene Fama and Ken French have integrated the factor into their new ” 5-factor model ,” which consists of a market factor, size factor, value factor, profitability factor, and an investment factor. This research was not lost on Dimensional Fund Advisors (DFA), a massive quantitative asset manager that is essentially an extension of University of Chicago Finance Department. DFA has added the concept of profitability to their process (we assume it is the profitability factor identified by Fama and French). In the words of Eduardo Repetto, DFA’s CIO, regarding profitability: New research has to be very robust, very reliable and have real information that’s not already captured in the other dimensions. But how robust is the so-called profitability factor? Is it possible that the profitability factor might already be captured in other dimensions? A new paper entitled, “A Comparison of New Factor Models,” by Kewei Hou, Chen Xue, and Lu Zhang, shows that the profitability factor is not, in fact, a new “dimension,” as has been suggested. The authors find that the profitability factor highlighted by Fama and French is captured in cleaner ways by their simpler and more robust 4-factor model, which consists of a market factor, a size factor, an investment factor, and a return-on-equity factor. The authors highlight that there are “four concerns with the motivation of the Fama and French model based on valuation theory,” suggesting that the factors chosen by Fama and French are merely descriptive and/or data-mined, but not grounded in economic theory. Ouch. But the critique of the 5-factor model isn’t only on theoretical grounds, it is also based on the evidence. The Hou, Xue, and Zhang 4-factor model captures all the returns associated with the new factors outlined by Fama and French. Note the alpha estimates below. The yellow box highlights the alphas associated with the FF factors, controlling for the Hou, Xue, and Zhang factors, and the blue box highlights the alphas associated with the Hou, Xue, and Zhang factors, controlling for the FF factors. The Hou, Xue, and Zhang factors can explain the FF factors, but the FF factors cannot explain the Hou, Xue, and Zhang factors. This suggests that the “new” profitability factor may not be a new dimension at all, since it can be explained via exposures to the market, size, and Hou, Xue, and Zhang’s investment and ROE factors. (click to enlarge) The results are hypothetical results and are NOT an indicator of future results and do NOT represent returns that any investor actually attained. Indexes are unmanaged, do not reflect management or trading fees, and one cannot invest directly in an index. Additional information regarding the construction of these results is available upon request. Profitability is also questionable in international markets. In a working paper, ” The Five-Factor Fama-French Model: International Evidence ,” by Nusret Cakici, the author looks at the performance of the five-factor model in 23 developed stock markets. There is only marginal evidence the factor works globally. In some markets, the factor is effective, but in other regions such as Japan and Asia-Pacific, the factor simply doesn’t explain returns. Our own internal research on the matter is consistent with this result. Concluding remarks regarding the profitability factor A lack of unified results often hints towards a lack of robustness and/or data-mining. Only time will tell if the out-of-sample performance of the so-called profitability factor will hold. There are certainly a lot of smart academics and investment houses leveraging the factor as a way to capture higher returns, so we can’t rule anything out. However, our advice is to tread lightly in the factor jungle, being sure to always carry a heavy machete to chop away at noisy data and the overfitting problems that accompany them. Original Post