Tag Archives: investing ideas

Use Dividend Stocks And ETFs To Augment Long-Term Returns

Long-term investors should use high-quality dividend stocks and ETFs. Dividend stocks provide greater total returns, with dividend reinvestment, over the long term. While high dividends are nice, investors should also focus on high quality. Over the long term, high-quality, dividend-paying stocks and exchange-traded funds could produce outperforming results. Stocks with high dividend yields are the best way for investors to buy income in the current market, and if the positions are held over the long haul through short-term volatility, one may find the investment outperforming the overall market on a total return basis, writes Philip van Doorn for MarketWatch . For instance, the S&P 500 Dividend Aristocrats, which tracks over 50 stocks that have raised their dividends annually over at least 25 years, has outperformed the S&P 500 over long periods. Over the past 10 years, the S&P 500 Dividend Aristocrats have generated a 178% total return, with dividends reinvested. In contrast, the S&P 500 index has returned 117% over the same period. ETF investors can also track the S&P 500 Dividend Aristocrats through the ProShares S&P 500 Aristocrats ETF (NYSEArca: NOBL ) . NOBL has increased 11.4% over the past year, compared to the 10.4% gain in the S&P 500. The ETF also comes with a 1.62% 12-month yield. Additionally, research has found that high-quality, high-dividend stocks tend to outperform and produce better risk-adjusted returns. For instance, Chris Brightman, Vitali Kalesnik and Engin Kose found that among the largest 1,000 U.S. companies, a smaller group of 100 high-yield, high-profitability companies generated the highest total returns with the lowest volatility from 1964 through 2014. Brightman, Kalesnik and Kose also screened for quality, or distress risk, and accounting red flags, and found that the high-quality firms typically outperformed low-quality businesses. However, investors had to give up some dividend growth rates when picking high-quality companies. Investors can also track high-quality, high-dividend stocks through ETF options. For instance, the iShares Core High Dividend ETF (NYSEArca: HDV ) , which tracks high-quality U.S. companies that have been screened for financial health and relatively high dividends, has a 12-month yield of 3.40%. The Vanguard High Dividend Yield ETF (NYSEArca: VYM ) targets the largest and highest dividend-paying stocks and comes with a 2.84% yield. VYM does not sacrifice quality for its quest for yield. Instead, the ETF includes a blend of both approaches and includes about 50% of its assets in stocks with wide economic moats, according to Morningstar . Max Chen contributed to this article . Disclosure: I/we have no positions in any stocks mentioned, and no plans to initiate any positions within the next 72 hours. (More…) I wrote this article myself, and it expresses my own opinions. I am not receiving compensation for it. I have no business relationship with any company whose stock is mentioned in this article.
How To Get More Momentum Out Of A Nasdaq ETF

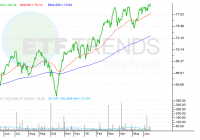
Summary The Nasdaq provides tilts toward more growth-oriented stocks. Growth stock investors can add even more momentum to their Nasdaq exposure through a relatively new smart-beta Nasdaq ETF. A closer look at the PowerShares DWA Nasdaq Momentum Portfolio. By Todd Shriber & Tom Lydon Home to a bevy of growth stocks, many hailing from the biotechnology, Internet and technology spaces, the Nasdaq-100 and Nasdaq Composite offer investors easy access to growth and momentum fare. Investors that want to add some more momentum to their Nasdaq exposure can do so with the PowerShares DWA NASDAQ Momentum Portfolio (NasdaqGM: DWAQ ) , an overlooked, momentum-laden alternative to the widely followed PowerShares QQQ (NasdaqGM: QQQ ) , the NASDAQ-100 tracking exchange traded fund. DWAQ tracks the Dorsey Wright NASDAQ Technical Leaders Index. That index is comprised of “a universe of approximately 1,000 common stocks having the largest market capitalizations and traded on the NASDAQ exchange,” according to PowerShares . Like the other PowerShares ETFs that track Dorsey Wright’s relative strength-based indices, DWAQ is passively managed. However, the relative strength methodology lends itself to increased flexibility in weighting and component selection compared to traditional cap-weighted ETFs. Depending on what individual investors are looking for, DWAQ offers some perks relative to QQQ. As a cap-weighted ETF, QQQ throws almost 21% of its combined weight at Apple (NASDAQGS: AAPL ) and Microsoft (NASDAQGS: MSFT ). Conversely, DWAQ’s largest holding is biotech giant Gilead (NASDAQGS: GILD ), which commands a weight of just 3.2% in the ETF, according to issuer data. Speaking of healthcare and biotech stocks, oft-cited catalysts behind QQQ’s ability to return and exceed dot-com era highs, DWAQ does not short change investors on healthcare exposure, either. The $36 million DWAQ sports a healthcare weight of almost 37%, more than double the 15.4% QQQ allocates to the same sector. Six of DWAQ’s top 10 holdings are healthcare stocks. The ETF’s second-largest sector weight is 22.4% to technology, which includes a 2.9% allocation to Apple. Like the other PowerShares ETFs that track Dorsey Wright’s relative strength-based indices, DWAQ is passively managed. However, the relative strength methodology lends itself to increased flexibility in weighting and component selection compared to traditional cap-weighted ETFs. QQQ’s consumer discretionary weight is nearly 400 basis points higher than DWAQ’s and the latter takes a notably different approach to that sector than the former. For example, DWAQ does not own Amazon (NASDAQGS: AMZN ), Priceline (NASDAQGS: PCLN ) and Starbucks (NASDAQGS: SBUX ), opting for mid- and small-cap discretionary names, such as Papa John’s (NASDAQGS: PZZA ), Sonic (NASDAQGS: SONC ) and Jack in the Box (NASDAQGS: JACK ). DWAQ is up 12.6% this year and has double in price in less than five years. PowerShares DWA NASDAQ Momentum Portfolio (click to enlarge) Disclosure: I am/we are long QQQ. (More…) I wrote this article myself, and it expresses my own opinions. I am not receiving compensation for it. I have no business relationship with any company whose stock is mentioned in this article.

How To Tap Into Developed Market Dividend Growth

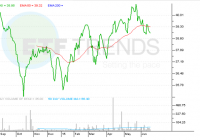
Summary Developed markets offer attractive dividend growth opportunities. A highlight of the ProShares MSCI EAFE Dividend Growers ETF. Breakdown of developed countries and their dividend prospects. By Todd Shriber & Tom Lydon The U.S. remains the benchmark destination for dividend growth, but some other developed markets are credible payout growth destinations. That theme can be accessed with several exchange traded funds, including the ProShares MSCI EAFE Dividend Growers ETF (NYSEArca: EFAD ) . EFAD, which debuted in August, tracks MSCI EAFE Dividend Masters Index, which holds members of the MSCI EAFE Index that have increased their dividends for at least 10 straight years. The emphasis on dividend increase streaks is the backbone of some of the most popular U.S.-focused dividend ETFs. At the country level, EFAD is top heavy as over 48% of its geographic weight is allocated to the U.K. However, that is not a problem for an international dividend growth ETF because the U.K. is one of the best, if not the best, ex-U.S. dividend growth markets. In 2014, U.K. firms once again offered excellent dividend growth. Payouts there surged 31% to $135 billion, according to Henderson Global Investors. Despite the overweight U.K. position, EFAD’s other country holdings offer ample room for dividend growth as highlighted by the ETF’s 1.2% 30-day SEC yield. Japan, EFAD’s third-largest country allocation at nearly 8%, is finally starting to climb the dividend ladder. For the year ended March 31, total dividends paid in Japan are expected to have risen 13% to $79.5 billion. It is estimated that total payouts in Japan this year will be more than triple the number seen in 2013. The average dividend yield for Tokyo Stock Exchange first-section companies, which include almost all of Japan’s top names, is 1.36%, according to the Wall Street Journal . Switzerland, EFAD ‘s second-largest country weight at 9.8%%, is one of the steadiest Europe ex-U.K. Dividend growth markets. Estimates indicate that in 2014, the 20 largest firms listed on Switzerland’s benchmark Swiss Market Index paid a record $37.2 billion in dividends. Australia, EFAD’s fourth-largest country weight at almost 5.6%, is another high-yielding developed dividend growth market. “According to figures from Bloomberg and Lincoln Indicators, that has seen dividend payouts by Australia’s top 200 companies jump by 64 per cent in 5 years – from $38 billion in 2010 to $62 billion to date this financial year,” according to Australia’s ABC News . Australia is one of the countries where the dividend yield on the benchmark equity index is higher than the yield on government bonds. Investors are starting to embrace EFAD’s story as the ETF has more than doubled in size during the second quarter. ProShares MSCI EAFE Dividend Growers ETF (click to enlarge) Disclosure: I/we have no positions in any stocks mentioned, and no plans to initiate any positions within the next 72 hours. (More…) I wrote this article myself, and it expresses my own opinions. I am not receiving compensation for it. I have no business relationship with any company whose stock is mentioned in this article.