Tag Archives: warren-buffett

Book Review: Quantitative Value

Wesley Gray, manager of the ValueShares US Quantitative Value ETF (BATS: QVAL ), may very well be the most interesting quant you’ll ever meet. Granted, the word “quant” brings to mind an old man in a white lab coat stooped over reams of data, but hear me out. Before getting his PhD in finance from the University of Chicago, Gray did four years of service as an active-duty U.S. Marine Corps ground intelligence officer in Iraq and other posts throughout Asia. Quantitative Value isn’t even his first book. That distinction goes to Embedded: A Marine Corps Adviser Inside the Iraqi Army . It’s hard to imagine the average fund manager crawling through the muck and gathering intelligence in Iraqi Arabic. But that is Dr. Gray, and his work is far from average. Quantitative Value , co-written by Gray and Tobias Carlisle, is a solid piece of research that combines the successful value investing framework of Benjamin Graham and Warren Buffett with the analytical rigor seen in Jim O’Shaughnessy’s What Works on Wall Street and Joel Greenblatt ‘s The Little Book that Beats the Market . In fact, Gray and Carlisle write extensively about Greenblatt’s “Magic Formula” and much of the book is an attempt to build the proverbial better mousetrap. We’ll take a look at some of Gray and Carlisle’s methods and then see how they perform in the real world by tracking the returns of the Quantitative Value ETF. The Quantitative Value screening process for stocks resembles a funnel: Step 1: Avoid Stocks That Can Cause a Permanent Loss of Capital This is a more elegant version of Warren Buffett’s first rule of investing: Don’t lose money. In first screening for risky stocks, Gray and Carlisle use some of the same metrics used by short seller John Del Vecchio to identify short candidates, such as days sales outstanding. They also give special attention to accrual accounting in the hopes of weeding out earnings manipulators and run additional screens for probability of financial distress. By removing the riskiest stocks from the pool at the beginning, Gray and Carlisle are a lot less likely to get sucked into a value trap. Step 2: Find the Cheapest Stocks Gray and Carlisle do extensive back testing on virtually every valuation metric under the sun, including industry standards such as price/earnings (“P/E”), price/sales (“P/S”) and price/book value (“P/B”). In the end, they opt to use the same valuation metric as Greenblatt in his Magic Formula: the Earnings Yield, defined here as earnings before interest and taxes (“EBIT”) divided by enterprise value. For those unfamiliar with the term, “enterprise value” is defined here as market cap (including preferred stock) + value of net debt, or what you might think of as the acquisition price of the company. Gray and Carlisle find that of all the assorted valuation metrics, the Earnings Yield yields the best results. Step 3: Find Highest-Quality Stocks This is another nod to both Buffett and Greenblatt. Buffett has repeated often that it is better to buy a wonderful business at a fair price than a fair business at a wonderful price, and Greenblatt tried to capture this mathematically by screening for companies that generated high returns on capital (“ROC”). Gray and Carlisle take it a step further by using an 8-year ROC figure. And they don’t stop there. Gray and Carlisle run additional screens for profitability and combine the metrics into a Franchise Power score. And taking it yet another step, they combine Franchise Power with Financial Strength to form a composite Quality score. Again, the objective here is to capture mathematically what makes intuitive sense: That companies with wide competitive moats, strong brands and strong balance sheets make superior long-term investments. So, how does the Quantitative Value model actually perform? In back-tested returns, it crushed the market. From 1974 to 2011, Quantitative Value generated compounded annual returns of 17.68% to the S&P 500’s 10.46%. Of course, we should always take back-tested returns with a large grain of salt. For a better comparison, let’s see how the Quantitative Value ETF has performed in the wild. We don’t have a lot of data to work with, as QVAL only started trading in late October 2014. But over its short life, QVAL is modestly beating the S&P 500’s price returns, 9.96% vs. 9.15%. As recently as April, it was beating the S&P 500 by a cumulative 4%. Looking at the returns of a substantially-similar managed account program managed by Gray’s firm, the “real world” results look solid. From November 2012 to May 2015, the Quantitative Value strategy generated compounded annual returns of 21.1% vs. the 18.3% return of the S&P 500. The Quantitative Value strategy was modestly more volatile (beta of 1.2) and had slightly larger maximum drawdowns (-6.0% vs. -4.4%). But this is exactly what you would expect from a concentrated portfolio. I look forward to seeing how QVAL performs over time, and I congratulate Gray and Carlisle on a book well written. Note: When referring to the book, “Quantitative Value” is italicized. When referring to the ETF or to the broader strategy, it is not. Original post Disclaimer: This article is for informational purposes only and should not be considered specific investment advice or as a solicitation to buy or sell any securities. Sizemore Capital personnel and clients will often have an interest in the securities mentioned. There is risk in any investment in traded securities, and all Sizemore Capital investment strategies have the possibility of loss. Past performance is no guarantee of future results.
Warren Buffett’s Stellar Record In Defying Economic Gravity

One of the more intriguing observations in Berkshire Hathaway’s new letter to shareholders is Warren Buffett’s reference to what I like to call economic gravity, a.k.a the law of large numbers. There are several ways to keep it at bay (maybe), but in the end it wins no matter what you do. Buffett and company, of course, have an extraordinary history of excelling where so many others have stumbled in this regard. But an unusually long run of success is taking its toll. As Buffett himself recognizes, gravity’s pull is increasing on Berkshire’s prospects. The observation inspires some brief ruminating on how to think about economic gravity generally in the realm of designing and managing investment portfolios. Let’s begin with the salient fact that deserves to precede any discussion of investing that ties in with Buffett, namely: he’s an anomaly in terms of his investment record. That’s something to cheer about if you’ve been a Berkshire shareholder over the last 50 years. But he’s managing expectations down these days: The bad news is that Berkshire’s long-term gains – measured by percentages, not by dollars – cannot be dramatic and will not come close to those achieved in the past 50 years. The numbers have become too big. I think Berkshire will outperform the average American company, but our advantage, if any, won’t be great. Eventually – probably between ten and twenty years from now – Berkshire’s earnings and capital resources will reach a level that will not allow management to intelligently reinvest all of the company’s earnings… Success ultimately plants the seeds of its own destruction… or mediocrity. Buffett, of course, has skirted this curse quite spectacularly through the decades, largely through an uncanny mix of raw talent and steely discipline. A handful of other investors have achieved something similar over long periods of time, but theirs is a tiny club and membership opportunities are limited in the extreme. Accordingly, the overwhelming majority of investment results fall within two standard deviations of the median performance for a relevant benchmark, and that’s not going to change… ever. We’re all fishing in the same pond. The critical differences that separate portfolios (and results) come down to two key factors: asset allocation and rebalancing. Buffett, of course, has opted for a fairly unique asset allocation, as reflected in the companies he’s purchased through the years. The list is a reflection of his talents as an analyst. It’s fair to say that he’s favored a degree of concentration, in large part due to his well-founded confidence in his capabilities to identify value. As for rebalancing, he largely shuns that aspect of portfolio management, which is a direct function of his confidence in security selection. It’s been a winning mix, in large part, due to talent. Concentrated bets with minimal rebalancing has been the basic strategy that’s kept economic gravity to a minimum at Berkshire through time. The results speak for themselves. But gravity- mediocre performance – wins in the end. The best-case scenario is minimizing its bite for a lengthy run, which surely describes Berkshire’s history. For mere mortals in the money game, however, gravity tends to weigh on results much sooner. The reason, of course, is a simple but extraordinarily powerful bit of wisdom attributed to Professor Bill Sharpe a la “The Arithmetic of Active Management” : Properly measured, the average actively managed dollar must underperform the average passively managed dollar, net of costs. There is a finite amount of positive alpha (market-beating performance) and it’s financed exclusively by negative alpha. Buffett’s spectacular achievements over the past 50 years have come at the expense of countless losing investment strategies. But having beaten the grim reaper of financial results for so long, the game is getting harder, as it must. The key point is that mediocrity beckons for every investor… eventually. For some of us (very few of us!) the day of reckoning is far off, due to talent and perhaps even some luck. But for the vast majority of investors (professional and amateur) this is one of those rare instances in money management when the future’s quite clear. This outlook suggests that it may be best to embrace mediocrity from the start via index funds and focus on those aspects of portfolio design and management where the odds look a bit more encouraging for enhancing results a bit. Whereas Buffett favored concentration and minimizing rebalancing, the average investor should do the opposite. In short, hold a multi-asset class portfolio, keep the mix from going to extremes (i.e., periodic rebalancing), and use index funds to keep costs low. It’s the anti-Buffett strategy, which is exactly the wrong strategy if you’re Warren Buffett. Then again, if you wait long enough, perhaps this advice becomes relevant even for the Oracle of Omaha.

The Big Lesson From A Bet With Warren Buffett

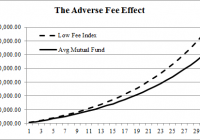
Seven years ago Ted Seides made a bet with Warren Buffett that a fund of hedge funds could outperform the S&P 500 over a ten-year period. As of today, that bet is looking very bad, with the S&P 500 beating the fund of funds by over 40% (63.5% vs. 19.6%). Seides wrote a piece for CFA Institute explaining why the bet has been wrong and some lessons from it. While Seides makes many good points, there’s one lesson that is particularly important in all of this: Seides explains that half of the underperformance is from fees: Just over half (24.4% ÷ 43.9% = 55.6%) of the underperformance by hedge funds can be attributed to fees. A full 19.5% of cumulative underperformance, or approximately 2.6% per annum, must have been caused by something else. That’s not exactly a glowing endorsement for high fee funds. Why would anyone pay more for less? The fact is, the investment world has become dirt cheap. You can get good financial advice for a fraction of the fee that you once had to pay. The entire hedge fund industry is living in the past, hoping to continue to suck 2&20 out of their unwitting clients for as long as they can. The reality is that you don’t have to pay high fees for smart advice any longer. Heck, I offer my asset management service for a measly 0.35% and I’d say I am a pretty “sophisticated” thinker. That’s what my mother tells me anyhow and I believe everything she says. More importantly, we’re entering a world where future returns are likely to be lower in the future. With bonds generating low yields, a balanced portfolio is either going to produce lower returns in the future or higher volatility returns as more of the gain is made up by stocks. This creates a problem for investors. If you’re paying high fees, you’re either paying more for lower risk adjusted returns OR your fees are eating into your returns by an increasingly large margin. If you’re looking at a real return (after inflation) of 6%-7% in stocks, then we have every reason to be mindful of any other frictions like taxes and fees that might reduce that return even further. But what is the average fee effect? To put things in perspective, consider that the average mutual fund charges 0.9% relative to the average low fee index which charges 0.1%. That’s a 0.8% difference. It doesn’t sound like much, but take a 7% compound annual growth rate on $100,000 and extend that over 30 years. Just how much of an impact does it make? The mutual fund ends up with a balance that is 23% lower than the index. In other words, the mutual fund could just mimic the return of the index and reduce your return by $150,000! Either way, the solution is simple. Stop paying high fees. My general rule of thumb is that you should almost never pay more than 0.5% for portfolio management. If you’re paying more than that, then I highly doubt you’re getting your money’s worth. Are you Bullish or Bearish on ? Bullish Bearish Neutral Results for ( ) Thanks for sharing your thoughts. Submit & View Results Skip to results » Share this article with a colleague