Tag Archives: income

2 Weeks Later: Did Mean Reversion Of CEFs Take Place?
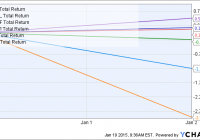
Summary Annual rebalancing in YYY/CEFL led to systematic inflation and suppression of CEF prices. A previous article suggested to sell the CEFs that were added to the index and to buy the CEFs that were removed, after the rebalancing date. Two weeks later, some evidence of mean reversion is observed, though most of these effects were not statistically significant. Introduction In a previous series of articles, we explored interesting events that happened to the YieldShares High Income ETF (NYSEARCA: YYY ), a CEF “fund-of-funds,” and the ETRACS Monthly Pay 2xLeveraged Closed-End Fund ETN (NYSEARCA: CEFL ), the 2X leveraged version of YYY, at the end of the year. Both funds are based on the ISE High Income Index [YLDA], which rebalances annually on the last trading day of each year. After ISE gave notice of the proposed changes that it planned to make to the index on 12/24/2014, we observed high-volume buying of CEFs that were to be added to YYY/CEFL, and high-volume selling of the CEFs that were to be removed. The latter acted to depress the prices of existing constituents in the fund, causing YYY to significantly underperform the PowerShares CEF Income Composite Portfolio ETF (NYSEARCA: PCEF ), a CEF fund-of-funds that tracks a different index. Moreover, we observed price “spikes” for the underlying CEFs at the close of 12/31/2014, suggesting that YYY/CEFL were forced to rebalance at unfavorable prices. On the next day, 1/2/2015, YYY fell 1.25% (and CEFL fell 2.96%) on a day where stocks, bonds and PCEF held relatively flat. YYY Total Return Price data by YCharts The second of the articles suggested a third possible way in which YYY/CEFL investors could lose money: reversion of premium/discount values of the CEFs that had been added to the index. The heavy buying of these CEFs had pushed the premium/discount values of those funds to higher (i.e. more expensive) levels, leaving investors in those funds susceptible to reversion in premium/discount values. Thus, the article suggested to sell the CEFs that were added to the index and to buy the CEFs that were removed from the index to take advantage of mean reversion. This article provides an update on whether that hypothesis played out. Results and discussion The second of the articles was published on 1/6/2015, as it took me a few days to piece together the events surrounding the rebalancing event. Nevertheless, I will be using 1/2/2015 as the starting point for the performance comparisons as this is the day after the rebalancing took place. CEFs that were added We first consider the 10 CEFs that had the highest increases in allocation upon YYY rebalancing. Those 10 CEFs had increases ranging from 3.52% for ISD to 4.59% for DSL. The following graph shows the total return performance for those 10 CEFs from 1/2/2015 to 1/16/2015 (just over two weeks). EDD Total Return Price data by YCharts Those 10 CEFs had an average performance of -1.26%. The following table shows the premium/discount values for those 10 CEFs two weeks ago (1/5/2015) and today. CEFs are arranged in order of increasing premium/discount on 1/5/2015. Two weeks ago Today Change EDD -10.51 -10.42 0.09 GLO -10.2 -11.39 -1.19 PCI -9.43 -9.64 -0.21 HYT -9.22 -9.02 0.20 MCR -8.47 -11.98 -3.51 DSL -7.9 -8.06 -0.16 GHY -7.51 -5.13 2.38 ISD -7.11 -6.88 0.23 AWP -7.04 -11.52 -4.48 FPF -6.68 -7.85 -1.17 Average -8.41 -9.19 -0.78 We can see that premium/discount value of these 10 CEFs decreased by an average of -0.78%. The following chart displays the change in premium/discount values graphically, with CEFs arranged from the largest change to the smallest. We can see that 4 of the CEFs saw an increase in premium/discount value, while 6 of the CEFs saw a decrease in premium/discount value. Notably, the four funds that had the greatest decrease in premium/discount values (FPF, GLO, MCR and AWP) were the exact same funds that had the greatest positive deviation from 1-year historical premium/discount value two weeks ago (the largest white bars in this chart linked from my previous article). Overall, these data appear to support the hypothesis that the CEFs that were added to the index saw an inflation of value before rebalancing, making them susceptible to losses (average performance = -1.26%) as their premium/discount values reverted (average change in premium/discount = -0.78%). However, neither the average performance or the average change in premium/discount values were found to be statistically significant. CEFs that were removed We next consider the 10 CEFs that underwent the largest decreases in allocation upon rebalancing. Those 10 CEFs had decreases ranging from -4.18% for BOE to -5.76% for BCX. The following graph shows the total return performance for those 10 CEFs from 1/2/2015 to 1/16/2015 (just over two weeks). BOE Total Return Price data by YCharts Those 10 CEFs had an average performance of -0.08%. The following table shows the premium/discount values for those 10 CEFs two weeks ago (1/5/2015) and today. CEFs are arranged in order of increasing premium/discount on 1/5/2015. Two weeks ago Today Change BCX -16.01 -15.23 0.78 BOE -13.30 -12.27 1.03 ETJ -10.19 -9.82 0.37 JGH -9.59 -12.62 -3.03 MIN -9.29 -8.01 1.28 ETW -9.04 -7.75 1.29 NFJ -7.61 -6.57 1.04 ETV -4.11 -3.54 0.57 GAB -3.85 -2.75 1.10 PHK 48.45 55.84 7.39 Average -3.45 -2.27 1.18 We can see that premium/discount value of these 10 CEFs increased by an average of 1.18%. The following chart displays the change in premium/discount values graphically, with CEFs arranged from the largest change to the smallest. We can see that 9 of the CEFs saw an increase in premium/discount value, while 1 of the CEFs saw a decrease in premium/discount value. Overall, these data appear to partially support the hypothesis that the CEFs that were removed from an index saw a suppression of value before rebalancing. While the majority of CEFs saw an increase in premium/discount value (average change = 1.18%), this did not translate into a higher performance (average performance = -0.08%). As before, neither the average performance or the average change in premium/discount values were found to be statistically significant. Personal trade I also described my personal trade in the previous article: At the open of 1/5/2015, I sold all but a token position in CEFL, and instead replaced the position with ETW, ETV, NFJ, PHK and PTY. All five CEFs were removed from the index, and the first four were among the top 10 funds undergoing the largest decreases in allocation. The following chart shows the total return performance for CEFL and those 5 CEFs from 1/2/2015 (the close of this day roughly corresponds to the open of 1/5/2015) to today (about two weeks). ETW Total Return Price data by YCharts Happily, my selection of CEFs that I purchased at the open of 1/5/2015 did much better than CEFL over the past two weeks. The average of the 5 CEFs was +0.59%, while CEFL fell -3.75%. Summary Two weeks after rebalancing, the 10 CEFs that were added to the index saw an average decline of -1.26%, while the 10 CEFs that were removed from the index saw an average decline of -0.08%. Meanwhile, 8 CEFs that were not substantially impacted by rebalancing exhibited an average gain of +0.35%. However, a statistical test showed that none of these average performances were significantly different from 0%, with the -1.26% decline for the 10 CEFs that were added being the closest to significance (p-value = 0.066). Moreover, we saw some evidence of mean reversion in premium/discount values taking place. The average change in premium/discount of the 10 CEFs that were added was -0.78%, while that for the 10 CEFs that were removed was +1.18%. However, these average changes were again not significantly difference from 0%. The difference between the average premium/discount change of -0.78% for the 10 CEFs added compared with +1.18% for the 10 CEFs removed was close to being significant (p-value = 0.069). Has mean reversion for these batch of CEFs been fully played out? For CEFs like AWP, the answer is probably yes, as its premium/discount dropped 4.48 percentage points (from -7.04% to -11.52%) over the course of two weeks, and is now once again close to its 1-year average of -11.21%. One must look at each CEF individually to evaluate its deviation from its historical premium/discount averages. Hopefully, we will have a chance to revisit this idea at the end of 2015 to see if the same phenomenon occurs or whether these artificial deviations, being now more well-known, will be arbitraged away.
In Search Of Income: Municipal Bond CEFs (Part II)

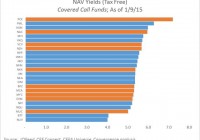
Summary Municipal bond funds currently offer high-tax-bracket investors with very attractive yields that can exceed 10% on a taxable-equivalent basis. Potential muni fund investors should consider, among other factors, yield, duration, and expense ratios when selecting from the more than 150 muni CEF choices. We recommend VCV and MCA to California-based investors, and MYI and VGM to non-Californians as well balanced choices for tax-free income. Our previous article profiled and analyzed the rewards and risks of closed-end funds that invest in municipal bonds. Please refer to that article for a background on the sector as a whole. This article will dig deeper into specific recommendations of especially attractive muni bond CEFs for income-seeking investors to consider. Universe of Included Funds The Convergence investing universe consists of more than 475 closed-end funds across all available equity and bond sectors, after filtering for funds that we consider not investable for a variety of reasons. The municipal bond sector is the largest of closed-end fund category with 150+ different fund choices. This analysis concentrates on 25 of the larger and more liquid muni bond funds. The Muni Bond segment consists of the following closed-end funds: BlackRock California Municipal Income Trust (NYSE: BFZ ) Blackrock Municipal Target Term Trust (NYSE: BTT ) Eaton Vance Municipal Bond Fund (NYSEMKT: EIM ) Eaton Vance California Municipal Bond Fund (NYSEMKT: EVM ) Invesco Value Municipal Income Trust (NYSE: IIM ) BlackRock MuniYield California Insured Fund (NYSE: MCA ) BlackRock MuniHoldings California Quality Fund (NYSE: MUC ) BlackRock MuniYield California Fund (NYSE: MYC ) BlackRock MuniYield Quality III Fund (NYSE: MYI ) Nuveen California Dividend Advantage Municipal Fund (NYSE: NAC ) Nuveen AMT-Free Municipal Income Fund (NYSE: NEA ) Nuveen Municipal Opportunity Fund (NYSE: NIO ) Nuveen California AMT-Free Municipal Income Fund (NYSE: NKX ) Nuveen Premium Income Municipal Fund (NYSE: NPI ) Nuveen Premium Income Municipal Fund 2 (NYSE: NPM ) Nuveen Performance Plus Municipal Fund (NYSE: NPP ) Nuveen Quality Income Municipal Fund (NYSE: NQU ) Nuveen Municipal Value Fund (NYSE: NUV ) Nuveen California Dividend Advantage Municipal Fund 3 (NYSEMKT: NZH ) Pimco California Municipal Income Fund II (NYSE: PCK ) PIMCO Municipal Income Fund II (NYSE: PML ) Invesco California Value Municipal Income Trust (NYSE: VCV ) Invesco Trust for Investment Grade Municipals (NYSE: VGM ) Invesco Municipal Trust (NYSE: VKQ ) Invesco Municipal Opportunity Trust (NYSE: VMO ) Evaluating Investment in Muni Bond Funds There are many qualitative and quantitative factors that prospective investors can consider when evaluating a closed-end fund. Convergence Investments summarizes these many factors into six dimensions useful for comparing and choosing investments: Distribution Yield – How much – and what type(s) – of distribution (aka “yield”) does the fund offer? How likely is it that the fund can maintain or increase this distribution in future? NAV Performance – How has a sector’s or individual fund’s NAV changed in the recent past? What is the outlook for future NAV trends? Valuation – Where is the current market price relative to current NAV for a fund or sector? How does this premium (or discount) to NAV compare to the past and to other fund categories? Risk – What level and type of risk is an investor bearing to earn distributions and potential capital gains? Stewardship – Does a fund have strong management? Are its management fees reasonable? Does the board have shareholder-friendly policies in place? Tradeability – How readily can we take a position (long or short) in a particular fund? What are the liquidity (market cap, average daily volume) and trading costs (average spreads, short borrow fees) involved? Distribution Yield Significant distribution yields are among the top motivators for closed-end fund investors. While there are many nuances to fund distributions, including how they’re generated and how sustainable they appear to be, the top-line yield number drives much of the sentiment and investor behavior. Generally, funds within the segment offer a NAV yield* of between 5 and 6% (tax-free). However, investors seeking maximum yield may give special consideration to NAC, VGM, or PML. The truly risk tolerant yield maximizers may consider PCK. * Note that numbers quoted here are calculated as a percentage of NAV rather than market price to provide a more accurate measure of the income generated from portfolio assets. Investors holding closed-end funds at a discount to NAV will earn yields greater than the NAV yields. For instance, a fund trading at a 10% discount will have a price yield of 10/9 ths or 1.11x the NAV yield. (click to enlarge) Please see the previous article for analysis of how tax-free yields compare to taxable yields. NAV Performance Investors disagree about how to interpret recent increases in net asset value. Momentum-oriented investors may see this as a trend likely to continue while mean reversion investors may see exactly the opposite. Convergence generally views recent increases in NAV as a positive factor at both the sector and fund level because we believe that sentiment-driven fund flows tend to play out over months & quarters, not days & weeks. We also view increasing NAV as an indicator of manager skill and of protection against cuts to a fund’s distribution. Muni bond funds have shown remarkable NAV growth strength in the past 12 months. As the chart shows, fund NAV values have generally risen between 10 and 15% in the past year. We believe this strength is a positive as it can provide a cushion against near-term distribution cuts. (click to enlarge) Valuation A major reason to invest in closed-end funds rather than ETFs or traditional mutual funds is the possibility for informed investors to take advantage disconnects between fund price and fund NAV, often referred to as the fund’s premium or discount. We seek to purchase funds at sizeable discounts, and ideally at discounts beyond that which is normal relative to history and/or relative to a fund’s peers in category. Purchasing at a discount offers two attractions. First, purchasing at a discount enhances yields since an investor can own the rights to the income generated from a hypothetical $10 of net assets with only $9 of investment. Second, for investors willing to actively manage their holdings, funds purchased at particularly wide discounts can be sold at narrower discounts – or even premiums – for capital gains that enhance the total returns from a fund. Note: Convergence follows the convention of representing all premiums (price > NAV) as a positive number and all discounts (price < NAV) as a negative value. Funds in this sector are generally trading at moderate discounts of 5 and 10%, with BTT, NQU, and NPI offering the widest discounts. For California fund buyers, MUC stands out with a nearly 9% discount. (click to enlarge) Risk There are no investment free lunches. Municipal Bond CEFs offer significant yields to investors as compensation for the various risks that investors are being asked to take. The principal risk that municipal bond investors are being paid to bear is that of interest rate risk. The most common measure of how sensitive a certain bond or bond fund is to shifts in the yield curve is the duration of that fund. Funds that have bonds further from maturity tend to have longer durations and are more sensitive to interest rate changes. The evaluated funds typically have average duration of between 7 and 12 years, though several of the (click to enlarge) (click to enlarge) Expenses Expense ratios are almost universally accepted as an important criteria in fund selection. However, the unique structure of closed-end funds makes the calculation of relevant expense ratios non-trivial. Convergence favors using a measure of management fees, excluding cost of leverage, as a percent of gross assets instead of the typically higher ratio that complies with "40 act" reporting requirements. In our opinion, ability of CEFs to use leverage with borrowing costs far below what we would pay a broker is to our benefit and cost of capital borrowed for investors' benefit should not be a strike against fund managers. Further, we believe that measuring the expense ratio we pay to fund managers per dollar of portfolio assets they are managing is a more fair way of measuring value-for-money when comparing fees among CEFs or when comparing CEFs to unlevered structures like mutual funds and ETFs. On this adjusted basis, management fees generally fall in the neighborhood of 1.0%. Some of the larger funds, like NUV and BTT, offer significantly lower management fees for investors that balk at 1% expense ratios. (click to enlarge) Conclusion As this article has outlined, there are many dimensions on which you may compare funds. However, we highlight four funds of interest based on their across-the-board attractiveness - two with National portfolios and two that are specific to California issues. National BlackRock MuniYield Quality III Fund - This fund is a high income and relatively low risk candidate. It has a high dividend of 5.73% on NAV and an average duration of 7.7 years, which is low by municipal bond fund standards. Its management, BlackRock reported that as of 2013, 86% of its portfolio was insured. Moreover, it holds $0.21 per share of Undistributed Net Investment Income (UNII) which covers it for about three months of distributions. Invesco Trust for Investment Grade Municipals - This choice offers high income (5.94%) despite a relatively low duration (i.e., sensitivity to interest rate changes) of 5.48 years, though its leverage ratio of 38.61% of NAV is relatively aggressive. At present the fund is selling for 9.57% below NAV, further amplifying distribution yield. Note that the fund does carry a relatively high adjusted expense ratio of 1.03%. California Invesco California Value Municipal Income Trust - This well rounded choice offers a distribution yield near the top of California munis with a 5.63% tax-free yield that can exceed 11% on a tax-equivalent basis for high bracket taxpayers. Founded in 1993 it has performed well over the years. Its discount to NAV has narrowed recently, currently at -5.9% as compared to its -8.4% average for 2014. Average credit quality of its portfolio is BBB. BlackRock MuniYield California Insured Fund - This fund is a conservative choice which still generates moderate income. BlackRock reports an extremely low duration of 5.5 years and carries by a very healthy average credit rating of AA-. Yet, despite the relatively lower risk, it still generates meaningful distribution yield of 5.6%, which could equate to greater than 10% taxable-equivalent yield for some individuals. Additional disclosure: Convergence Investment Management may recommend various securities included within this article for inclusion for individual client portfolios. These recommendations may change at any time and are specific to the individual client's objectives and risk tolerance.

Middlesex Water: 42 Years Of Dividend Growth

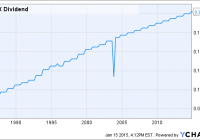
The shares currently sport a yield of about 3.5%. Utilities are notorious for being a great defensive play. Estimates for 2015 point to continued strong growth. Middlesex Water (NASDAQ: MSEX ) is a lightly followed water utility company based in New Jersey. The company operates in NJ as well as a couple of the surrounding states providing water related services. I found Middlesex while looking for attractive yields that are sustainable. Middlesex most definitely meets both of those traits. The company is worth a deeper look and at least an add to a watchlist. So the obvious first, the yield is nice at 3.5%. The company has had dividend growth for the past 42 years according to Dividend.com , most recently announcing an increase this past November. This increase puts the annual dividend at 77 cents a share with a current payout ratio of about 70%. While this may seem a bit high I don’t believe with a utility company like Middlesex it is something to be concerned with especially with the history of payments the company has. Below is the chart of the quarterly dividend growth since the late ’80s. Clearly other than the one disruption, which was for one quarter, there is a consistent uptrend. MSEX Dividend data by YCharts The company’s growth in general looks pretty as well. Both revenue and earnings have seen nice increases over the past few years and this trend also looks to be continuing. Year Revenue EPS 2013 $114.85M $1.03 2014 $117.29M(Est) $1.12 2015 $121.77M(Est) $1.19 (Sources for data and estimates: FT.com ) Using the estimates we see between 2013 and 2015 revenue is expected to increase another 6%, and EPS are expected to rise another 15.5%. EPS in 2015 of $1.19 would point to a payout ratio close to 64%, which means it will obviously practical for the dividend to be increased again. The great part about Middlesex is the fact that it is a great defensive play. There has been a crazy amount of noise that we are fast approaching a bear market with many companies way overvalued. I can’t argue with that last part. There are plenty of companies in this market overvalued. I also can’t say if there is a bear market coming or if there will just be a short-term correction. I do know that history tells us whatever the economic environment is Middlesex still performs well. The market has been up and down dozen of times in the past 42 years. Middlesex was still able to increase its dividend all those years. The fact is that water and water-related services will never go out of style. The barriers to entry are high so Middlesex doesn’t need to be overly concerned about competition as well. For a company that has done business since 1897 I don’t foresee any major problems anytime soon. In conclusion, I think Middlesex is a great play in a potentially rocky market. The yield is attractive at these levels and if the shares drop back a little more I think it would be a extremely good opportunity to pick some up. This year the company will celebrate its 118th birthday and likely increase its dividend for a 43rd year. Additional disclosure: Always do your own research before investing. Now that you’ve read this, are you Bullish or Bearish on ? Bullish Bearish Sentiment on ( ) Thanks for sharing your thoughts. Why are you ? Submit & View Results Skip to results » Share this article with a colleague