Spark Energy’s Income Statement Is In For Some Pain
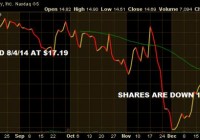
I’m taking my losses and selling SPKE before Q4 earnings. SPKE has abandoned its plan to increase spending to acquire customers and has now doomed its income statement. SPKE’s model isn’t built for constant shifting between high and low spending and this will create many problems. In hindsight I always knew what Spark Energy (NASDAQ: SPKE ) was, and I detailed that in my initiation article, so maybe I shouldn’t be as disappointed in how this trade turned out as I am, because I’m actually really disappointed. I’m selling SPKE on Monday at the open down 14.5% or so (depending on where this stock opens) for a couple reasons but primarily because the company has no idea what it’s doing. It’s literally operating in an industry where all you have to do is spend endlessly to acquire customers (welcome to the S&M black hole!), pray that you can do a decent job at hedging exposure to natural gas (creating the spread that creates the margin), do a good enough job to hang on to the majority of customers (but trust that there will in fact be churn), hope the share price goes higher, raise debt or finance via equity offering, and repeat the process. The most important must-do by far of those listed is spend, by the way. That’s all you have to do. Heck, I’ll make it even simpler for you SPKE – use your new revolver, yeah the one with the $37.9 million in current borrowing availability and go acquire customers. It’s that easy. Just spend, spend, spend! What do you not get about that? (click to enlarge) But of course, SPKE management couldn’t do that. No, SPKE management just announced on the Q3 CC that it’s executing its third strategic shift in as many years. What is this shift I speak of? Well, I’m speaking of the shift to (again) lower customer acquisition spending (this is after ramping customer acquisition spending in mid-2013 after lowering it in early-2012) to focus on “the longer-term sustainable growth consistent with our focus on distributable cash flow (SOURCE: SPKE Q3 CC )”, whatever that means. I say whatever-that-means because there’s nothing “longer-term” about SPKE’s business. It’s a commodity of the worst variety, meaning it has zero differentiation from competitors and zero value-prop to customers other than at any given point it can offer electricity services at a cheaper price than its competitors, which is by definition the definition of a commoditized business. This is pretty well evidenced in the attrition SPKE experiences regularly. I mean consider this, SPKE spent to acquire 91,000 customers between Q2 and Q3 while at the same time 44,000 customers walked through the door on the way to the next commoditized provider: (click to enlarge) Talk about an inefficient model. Now getting back to the stated reduction in spending and focus shift, this becomes a big problem because every time SPKE drops customer acquisition spending, as they did in FY2012, SPKE sees its revenues fall off a cliff. I’ve detailed this in SPKE’s financials in previous articles and even promoted this as a reason that “value” existed in buying the shares when I did. Of course this was under the assumption that management would actually do what it said it was going to do at the time I bought shares, which was spend, spend, spend. I only bought these shares because I wanted to piggy back on the ramped spending and the fact that the spending costs (customer acquisition costs) get recorded as an asset on the balance sheet and accounted for through D&A over 8 quarters. I wanted to front-run the what should have been explosive top-line growth with what would have been for a while minimal D&A additions to the income statement. This would have artificially enhanced the income statement and I was hoping propped the stock to a point that I could have sold at a healthy gain all while collecting a fat dividend for waiting. Yeah, it didn’t exactly turn out as planned. So, here we are with today’s “new model” that SPKE is promoting as the way of the future. Forget that the company has a horrible looking S-1 filing with three years of volatile financials and that the company has zero history of being able to execute on any single strategic initiative for more than a quarter or two. Don’t mind that. Let’s just get long some shares because, well, this is the way of the future. This is the “longer-term” more “sustainable” way to run this commoditized business. I think SPKE thinks it’s something it’s not and that can be a very dangerous thing. It has been for bagholders in the past and has been for this bagholder through 5 five months of ownership. The Ramp UP and The Ramp DOWN SPKE’s creating huge financial volatility for itself by constantly ramping up and ramping down spending. It’s also creating volatility for itself in not having a focused approach to its S&M efforts. SPKE also noted on its Q3 CC that it’s shifting its focus again back to commercial accounts, something it had completely abandoned after focusing on several years ago. You see a pattern here? SPKE seems to always be chasing the “hot dot” of the moment and seems to be the real case of the tail wagging the dog. Take a look at what it’s done for the income statement: (click to enlarge) So, first things first SPKE’s 9M results are absolutely blown up because 1H/14 was blown up by spending not being ramped until Q3/13. Let me explain how that works. SPKE can easily track revenues growth with S&M spending growth. What it can show is that once it increases spending, roughly three months into elevated spend levels revenue growth begins to turn upward. After about six months revenue growth reaches a terminal velocity where more spend is needed to created more velocity. That’s a pretty easy equation to follow. Now, I don’t know if that is uniform in this space or not but that’s what SPKE’s history has shown us. When SPKE decided to increase S&M spend in Q3/13 that means Q1/14 was only seeing terminal velocity of the initial increases in spend levels (which were increased from there further) and in fact the spend was being spread across larger geographic areas. This means that velocity was lower across a wider casted net which means sales were lower than they could have been had SPKE simply been concentrated (further saturating an area with spend). Yet another misstep. Regardless, that explains the 9M results showing such a variance from the Q3 results. Oh, by the way, we’re heading back to the days of reduced spending but don’t worry things are going to be different this time around because management has a plan. The 9M/14 results show flat top-line results, better NAO revenues (which are basically hedging gains or losses and largely SPKE has shown it has zero control and/or predictability in this line item), much higher operating expenses, and growing operating and net losses. This is inclusive of the benefit of a lower D&A expense, which will slowly be getting bigger quarter after quarter for the next six quarters before shrinking assuming SPKE actually maintains its plan to lower spending. There’s a huge amount of customer acquisition costs that have to be D&A’d to the income statement from the previous quarters spending ramps, regardless of if SPKE abandons the strategy half way through. What drove the 9M and quarterly results? S&M spending and hedging. That’s the entire business here folks. There’s a guy knocking on your door or a flyer in your mail offering you electric service. Is it at a lower cost or not? That’s what drives SPKE’s income statement. It’s really not that complicated but somehow SPKE has found a way to complicate it. What’s really sad is that had SPKE just stayed the course it might have been able to finally hit a vein regionally that it had some traction with or find a market that actually responded to its spending. I mean the cash is already gone, why not actually use what’s left on the balance sheet and dip into the revolver? Everything outlined in red is bad. The entire income statement is bad. I mean just look at that net income destruction Y/Y from ~$12 million to ~$7 million. Now, I’ll give SPKE that it hadn’t had a full 9M to show its increased spending and larger customer base within the 9M/14 figure, and subsequently SPKE went out and acquired some customers from outside sources so at least it’s trying the M&A route, but the comps it was up against in 2014 weren’t tough considering it didn’t ramp 2013 spending until Q3 as well. I just don’t have any sympathy for SPKE’s financials at this point because it’s doing this to itself. SPKE’s Adjusted EBITDA really shows the customer acquisition cost spend differential and why I say that once you start spending in this model you have to continue to spend forever, that the model basically becomes a constant black hole of S&M dollars: (click to enlarge) You can see how I’ve outlined the massive difference in customer acquisition costs in the comparable periods. In Q3/14 it was roughly 400% Q3/13, you don’t think that should have been driving revenues? You don’t think the ramp from previous quarters should have been driving revenues? The fact that the Q3 income statement showed flat revenues Y/Y in Q3/14 is a clear sign that the ship is already starting to take on water. That ramped spending is about to start to really add up on the income statement over the next few quarters in the form of a D&A uptick and SPKE isn’t going to have the revenues to offset it. It’s going to be taking huge losses on that when it happens. The spending difference becomes pretty egregious on the 9M side of the Adjusted EBITDA. 9M/14 customer acquisition costs were roughly 700% 9M/13 spending. Even with that, even with the compounding spending that should have reached maximum velocity from quarter prior SPKE still posted flat revenues. What an absolute disaster. This is going to bury SPKE’s stock over the next few quarters and was something I outlined in my prior articles. If SPKE didn’t have consecutive and sequential blowout top-line growth quarters you want nothing to do with this company. It won’t have the top-line to make up for the D&A uptick. That in a nutshell explains the bear thesis around this name going forward. This stock is dead, it just doesn’t know it yet. Do I need to even note those Adjusted EBITDA figures? Didn’t think so. Now, you can imagine what these types of operations have done for cash flows, which actually account for the cash outflows of the customer acquisition costs as they are incurred: (click to enlarge) Yeah, the cash from operations has been blown up and maybe that’s the reason for the strategy shift towards lower spending. Maybe SPKE management saw that what they were doing (again) wasn’t working and decided that conserving the last of the cash and the last of the liquidity via the revolver was the primary concern. I mean to hell with the income statement, that’s just for accounting nerds, the cash flow statement is dealing in real dollars, actual cash and when you run out of that and still don’t have a plan on the board for how you turn the corner and make it to spring you don’t get to play anymore. Even at minimal levels of revenues if SPKE can get spending down low enough it can generate good levels of FCF. Just look at both of these periods listed here. Solid FCF could allow the company to rebuild its cash balances and make one more run at another strategy shift or whatever else the company might have in mind. The point is, just don’t run out of cash. I think that’s probably the best explanation I have for what’s been announced and what’s about to be allowed to happen to the incomes statement. Where’s the trade? The trade is to sell SPKE and don’t ever consider it on the long side again. This business model and this niche isn’t one that you want to invest in for all the reasons mentioned in the beginning of this article. It’s a commodity with no way to differentiate itself and no way to protect itself from the wide swings that come with trying to hedge energy exposure on a constantly fluctuating demand. SPKE always was a bad business but I thought I could catch a few cheap points riding an accounting loophole that would have allowed revenue to grow while expenses remained artificially low on the income statement. I was wrong and lesson learned. I recommend a sell of SPKE. I look forward to providing continuing coverage in the future. Good luck to all.