Scalper1 News
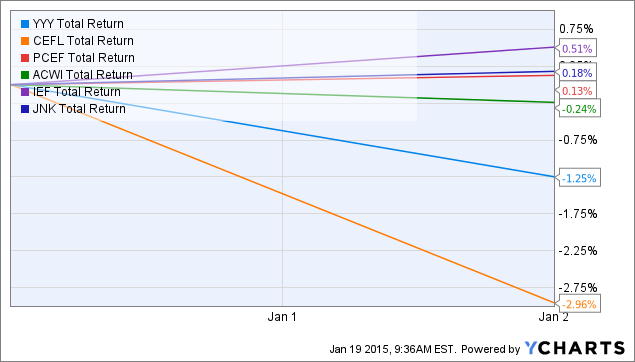
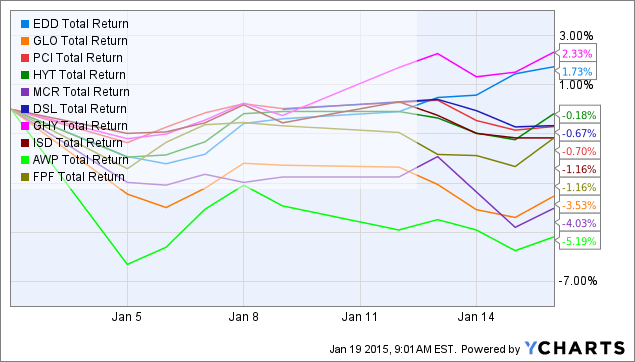
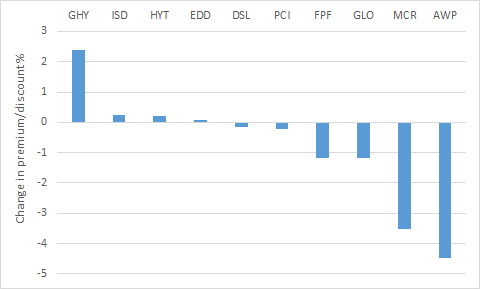
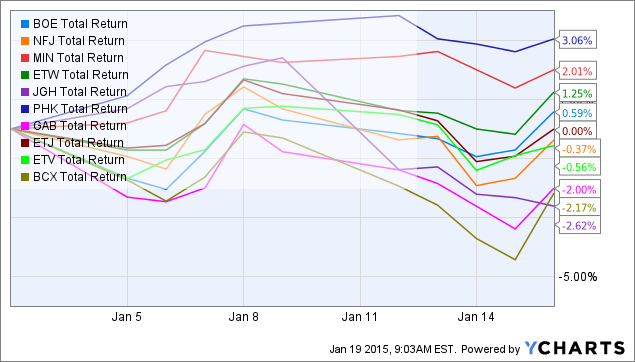
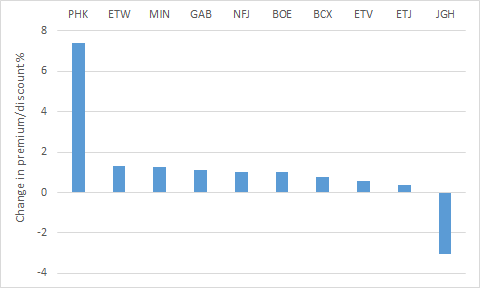
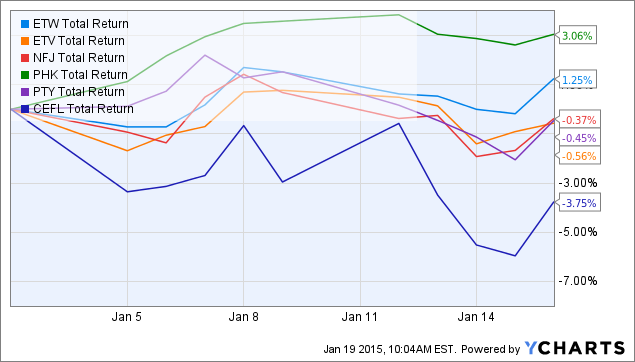 Summary Annual rebalancing in YYY/CEFL led to systematic inflation and suppression of CEF prices. A previous article suggested to sell the CEFs that were added to the index and to buy the CEFs that were removed, after the rebalancing date. Two weeks later, some evidence of mean reversion is observed, though most of these effects were not statistically significant. Introduction In a previous series of articles, we explored interesting events that happened to the YieldShares High Income ETF (NYSEARCA: YYY ), a CEF “fund-of-funds,” and the ETRACS Monthly Pay 2xLeveraged Closed-End Fund ETN (NYSEARCA: CEFL ), the 2X leveraged version of YYY, at the end of the year. Both funds are based on the ISE High Income Index [YLDA], which rebalances annually on the last trading day of each year. After ISE gave notice of the proposed changes that it planned to make to the index on 12/24/2014, we observed high-volume buying of CEFs that were to be added to YYY/CEFL, and high-volume selling of the CEFs that were to be removed. The latter acted to depress the prices of existing constituents in the fund, causing YYY to significantly underperform the PowerShares CEF Income Composite Portfolio ETF (NYSEARCA: PCEF ), a CEF fund-of-funds that tracks a different index. Moreover, we observed price “spikes” for the underlying CEFs at the close of 12/31/2014, suggesting that YYY/CEFL were forced to rebalance at unfavorable prices. On the next day, 1/2/2015, YYY fell 1.25% (and CEFL fell 2.96%) on a day where stocks, bonds and PCEF held relatively flat. YYY Total Return Price data by YCharts The second of the articles suggested a third possible way in which YYY/CEFL investors could lose money: reversion of premium/discount values of the CEFs that had been added to the index. The heavy buying of these CEFs had pushed the premium/discount values of those funds to higher (i.e. more expensive) levels, leaving investors in those funds susceptible to reversion in premium/discount values. Thus, the article suggested to sell the CEFs that were added to the index and to buy the CEFs that were removed from the index to take advantage of mean reversion. This article provides an update on whether that hypothesis played out. Results and discussion The second of the articles was published on 1/6/2015, as it took me a few days to piece together the events surrounding the rebalancing event. Nevertheless, I will be using 1/2/2015 as the starting point for the performance comparisons as this is the day after the rebalancing took place. CEFs that were added We first consider the 10 CEFs that had the highest increases in allocation upon YYY rebalancing. Those 10 CEFs had increases ranging from 3.52% for ISD to 4.59% for DSL. The following graph shows the total return performance for those 10 CEFs from 1/2/2015 to 1/16/2015 (just over two weeks). EDD Total Return Price data by YCharts Those 10 CEFs had an average performance of -1.26%. The following table shows the premium/discount values for those 10 CEFs two weeks ago (1/5/2015) and today. CEFs are arranged in order of increasing premium/discount on 1/5/2015. Two weeks ago Today Change EDD -10.51 -10.42 0.09 GLO -10.2 -11.39 -1.19 PCI -9.43 -9.64 -0.21 HYT -9.22 -9.02 0.20 MCR -8.47 -11.98 -3.51 DSL -7.9 -8.06 -0.16 GHY -7.51 -5.13 2.38 ISD -7.11 -6.88 0.23 AWP -7.04 -11.52 -4.48 FPF -6.68 -7.85 -1.17 Average -8.41 -9.19 -0.78 We can see that premium/discount value of these 10 CEFs decreased by an average of -0.78%. The following chart displays the change in premium/discount values graphically, with CEFs arranged from the largest change to the smallest. We can see that 4 of the CEFs saw an increase in premium/discount value, while 6 of the CEFs saw a decrease in premium/discount value. Notably, the four funds that had the greatest decrease in premium/discount values (FPF, GLO, MCR and AWP) were the exact same funds that had the greatest positive deviation from 1-year historical premium/discount value two weeks ago (the largest white bars in this chart linked from my previous article). Overall, these data appear to support the hypothesis that the CEFs that were added to the index saw an inflation of value before rebalancing, making them susceptible to losses (average performance = -1.26%) as their premium/discount values reverted (average change in premium/discount = -0.78%). However, neither the average performance or the average change in premium/discount values were found to be statistically significant. CEFs that were removed We next consider the 10 CEFs that underwent the largest decreases in allocation upon rebalancing. Those 10 CEFs had decreases ranging from -4.18% for BOE to -5.76% for BCX. The following graph shows the total return performance for those 10 CEFs from 1/2/2015 to 1/16/2015 (just over two weeks). BOE Total Return Price data by YCharts Those 10 CEFs had an average performance of -0.08%. The following table shows the premium/discount values for those 10 CEFs two weeks ago (1/5/2015) and today. CEFs are arranged in order of increasing premium/discount on 1/5/2015. Two weeks ago Today Change BCX -16.01 -15.23 0.78 BOE -13.30 -12.27 1.03 ETJ -10.19 -9.82 0.37 JGH -9.59 -12.62 -3.03 MIN -9.29 -8.01 1.28 ETW -9.04 -7.75 1.29 NFJ -7.61 -6.57 1.04 ETV -4.11 -3.54 0.57 GAB -3.85 -2.75 1.10 PHK 48.45 55.84 7.39 Average -3.45 -2.27 1.18 We can see that premium/discount value of these 10 CEFs increased by an average of 1.18%. The following chart displays the change in premium/discount values graphically, with CEFs arranged from the largest change to the smallest. We can see that 9 of the CEFs saw an increase in premium/discount value, while 1 of the CEFs saw a decrease in premium/discount value. Overall, these data appear to partially support the hypothesis that the CEFs that were removed from an index saw a suppression of value before rebalancing. While the majority of CEFs saw an increase in premium/discount value (average change = 1.18%), this did not translate into a higher performance (average performance = -0.08%). As before, neither the average performance or the average change in premium/discount values were found to be statistically significant. Personal trade I also described my personal trade in the previous article: At the open of 1/5/2015, I sold all but a token position in CEFL, and instead replaced the position with ETW, ETV, NFJ, PHK and PTY. All five CEFs were removed from the index, and the first four were among the top 10 funds undergoing the largest decreases in allocation. The following chart shows the total return performance for CEFL and those 5 CEFs from 1/2/2015 (the close of this day roughly corresponds to the open of 1/5/2015) to today (about two weeks). ETW Total Return Price data by YCharts Happily, my selection of CEFs that I purchased at the open of 1/5/2015 did much better than CEFL over the past two weeks. The average of the 5 CEFs was +0.59%, while CEFL fell -3.75%. Summary Two weeks after rebalancing, the 10 CEFs that were added to the index saw an average decline of -1.26%, while the 10 CEFs that were removed from the index saw an average decline of -0.08%. Meanwhile, 8 CEFs that were not substantially impacted by rebalancing exhibited an average gain of +0.35%. However, a statistical test showed that none of these average performances were significantly different from 0%, with the -1.26% decline for the 10 CEFs that were added being the closest to significance (p-value = 0.066). Moreover, we saw some evidence of mean reversion in premium/discount values taking place. The average change in premium/discount of the 10 CEFs that were added was -0.78%, while that for the 10 CEFs that were removed was +1.18%. However, these average changes were again not significantly difference from 0%. The difference between the average premium/discount change of -0.78% for the 10 CEFs added compared with +1.18% for the 10 CEFs removed was close to being significant (p-value = 0.069). Has mean reversion for these batch of CEFs been fully played out? For CEFs like AWP, the answer is probably yes, as its premium/discount dropped 4.48 percentage points (from -7.04% to -11.52%) over the course of two weeks, and is now once again close to its 1-year average of -11.21%. One must look at each CEF individually to evaluate its deviation from its historical premium/discount averages. Hopefully, we will have a chance to revisit this idea at the end of 2015 to see if the same phenomenon occurs or whether these artificial deviations, being now more well-known, will be arbitraged away. Scalper1 News
Scalper1 News