Tag Archives: handle

Vanguard Portfolio Part 5: 4th Quarter Results

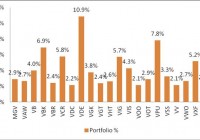
My portfolio gained 2.24% points in the fourth quarter. My portfolio’s end of year return was 9.88%. My portfolio beat 2 of 3 selected indices. The fourth quarter and year has ended for my all Vanguard portfolio . The quarterly and year to date reviews are below. Performance: My portfolio in the fourth quarter rebounded from the third quarter . It increased 2.24 percentage points. All three benchmarks performed better this quarter and all out performed my portfolio. The EOY return on my portfolio increased to 9.88%. I am still outperforming two of the indexes. I did so well the first half of the year that even though I slid in the second half I still did well. The table below shows the fourth quarter and YTD returns. 4th Qtr. % change EOY Return Vanguard 2.24% 9.88% S&P 500 5.79% 12.39% DJIA 6.6% 8.4% Russell 2000 10.99% 3.41% Below are the returns of all my positions at the end of the year. I took a piece of advice from a comment in my third quarter paper. I summed up the values of the same ETF in each different account. The table should be easier to read this time. Ticker % Chg Annualized Yield Vanguard Mega Cap Value ETF (NYSEARCA: MGV ) 13.13% 13.94% Vanguard Materials ETF (NYSEARCA: VAW ) 4.13% 6.60% Vanguard Small Cap ETF (NYSEARCA: VB ) 7.22% 10.04% Vanguard Small Cap Growth ETF (NYSEARCA: VBK ) 3.49% 4.57% Vanguard Small Cap Value ETF (NYSEARCA: VBR ) 7.37% 9.23% Vanguard Consumer Discretionary ETF (NYSEARCA: VCR ) 13.90% 15.14% Vanguard Consumer Staples ETF (NYSEARCA: VDC ) 14.24% 15.51% Vanguard Energy ETF (NYSEARCA: VDE ) -6.66% -8.22% Vanguard FTSE Developed Markets ETF (NYSEARCA: VEA ) -6.54% -12.18% Vanguard FTSE All-World ex-US ETF (NYSEARCA: VEU ) -5.71% -10.68% Vanguard Financials ETF (NYSEARCA: VFH ) 13.31% 17.03% Vanguard FTSE Europe ETF (NYSEARCA: VGK ) -4.72% -8.87% Vanguard Information Technology ETF (NYSEARCA: VGT ) 10.76% 56.76% Vanguard Health Care ETF (NYSEARCA: VHT ) 13.89% 18.99% Vanguard Dividend Appreciation (NYSEARCA: VIG ) 11.56% 12.58% Vanguard Industrials ETF (NYSEARCA: VIS ) 8.19% 10.34% Vanguard REIT Index ETF (NYSEARCA: VNQ ) 15.42% 8.44% Vanguard Mid Cap ETF (NYSEARCA: VO ) 9.45% 13.45% Vanguard Mid-Cap Value ETF (NYSEARCA: VOE ) 0.00% 65.22% Vanguard S&P 500 ETF (NYSEARCA: VOO ) 12.61% 18.06% Vanguard Mid-Cap Growth ETF (NYSEARCA: VOT ) 12.51% 17.34% Vanguard FTSE Pacific ETF (NYSEARCA: VPL ) 0.70% 0.84% Vanguard Utilities ETF (NYSEARCA: VPU ) 11.91% 18.33% Vanguard FTSE All-World ex-US Small-Cap ETF (NYSEARCA: VSS ) -4.07% -7.68% Vanguard Total World Stock ETF (NYSEARCA: VT ) -0.17% -0.32% Vanguard Value ETF (NYSEARCA: VTV ) 15.44% 16.83% Vanguard Growth ETF (NYSEARCA: VUG ) 12.48% 17.88% Vanguard Large Cap ETF (NYSEARCA: VV ) 6.49% 31.41% Vanguard FTSE Emerging Markets ETF (NYSEARCA: VWO ) -2.56% -2.77% Vanguard Emerging Markets Government Bond Index ETF (NASDAQ: VWOB ) -0.50% -0.58% Vanguard Extended Market Index ETF (NYSEARCA: VXF ) 6.96% 15.16% Vanguard Total International Stock ETF (NASDAQ: VXUS ) -4.43% -5.31% Vanguard High Dividend Yield ETF (NYSEARCA: VYM ) 11.67% 14.91% Vanguard Telecom Services ETF (NYSEARCA: VOX ) 4.56% 195.86% In the third quarter VTV was the only position that was over 10%. Now 14 ETFs have over a 10% return for the year. VNQ and VDC did the best this year. All the ETFs that are geared towards international stocks are in the red. It seems that every other country is still struggling. The energy sector is struggling too. VDE had the worst return and I lost over 6%. The number of positions that were negative from the third quarter to the end of the year went from 11 to 9. Looking at all my positions one can see why I didn’t do as well as the S&P. The S&P tracks the top 500 companies and is a good representation of the U.S. market. I have a lot of international positions and I already mentioned how all those were negative. Taking out those I would have had a return of over 12.5%. However, I am invested in those because I believe in diversification. Transactions: The fourth quarter was busy for trading. I had 72 trades which was more than the number of trades I had in the third quarter. Most of the trades were in the first few weeks of October as the market was dropping. I like to buy when everyone else sells and hold when everyone buys. I had a few major sells. I finished selling off all my positions in VCLT, BLV, and EDV. Interest rates were still low and when the market dropped in early October government bonds increased. I sold them and used most of profits to invest in VDE. The number of investments remained the same from the third quarter at 34. The chart below shows the ETFs that had more than a 2% weight. This is much different than the weights in the third quarter. The weights are more diverse. 20 ETFs are over 2%. VCLT was replaced by VDE as the highest weight. (click to enlarge) End of year comments: From looking back at my third quarter comments I stuck to my plan in the fourth quarter. When the market dipped at the start of October I was in buying mode and added to all my positions. From the middle of October to the end of the year the market went higher and I stopped trading and let the returns ride. I think overall my strategy worked out. This was the second best thing than to trading individual stocks. Most of my ETFs were positive. There were a few losers, but that’s how it goes. I was at the higher end of my 7-10% prediction. I didn’t expect the S&P to do a lot better, I thought I was closely tied to the market and that my portfolio should have tracked it almost perfectly. At the midpoint of the year my return was already up 9.77%. That means I was flat for the rest of the year. I expected much more at that point. 9.88% still beat 2 of the 3 benchmarks so I can’t be too disappointed. I think I am in a good position for the future. I think my positions in VDE and in the international ETFs will turn around next year. Since my portfolio did well there is nothing from deterring me from continuing the same strategy into next year. Now that you’ve read this, are you Bullish or Bearish on ? Bullish Bearish Sentiment on ( ) Thanks for sharing your thoughts. Why are you ? Submit & View Results Skip to results » Share this article with a colleague
Why Exelon Corporation Will Outperform The Market In 2015

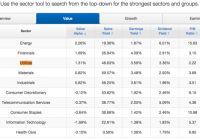
The strong rally in utilities will continue into 2015, despite statements to the contrary from analysts, as the sector is still strongly undervalued relative to the market. Exelon combines an attractive valuation with strong price momentum and EPS growth. We expect the stock to outperform the market by 8.7% over the next 12 months. Entergy Corporation, Hawaiian Electric, and Westar Energy are other electric utilities that look poised to outperform the market in 2015. A) Introduction The Utilities sector surprised many by posting the best price performance in the market in 2014. Electric utility companies were a particularly strong subset of the sector, posting an average gain of 31% during the course of the year. At this point, many investors are questioning whether the current rally will continue, especially with rising interest rates on the horizon (high interest rates hurt utilities). On Wednesday, Michael Purves, the head of equity derivatives research at Weeden & Co, advised investors to “start to take profits given the run is getting long in the teeth.” Contrary to common sentiment, we feel the sector’s momentum and growth should serve a signal of further outperformance, as the sector is still strongly undervalued relative to the overall market. Investors unfamiliar to our style of analysis should know that we solely look at metrics that have a long historical track record of predicting stock returns. We’ll first analyze how the overall Utility sector stacks up to the other nine sectors in ten metrics that have been academically shown to predict returns. Then, we’ll look into which stocks within the Electrical Utility industry group look poised to lead the group, again looking at value, momentum, and earnings. B) Top-Down Analysis of the Utility Sector In deciding whether to invest in certain utility stocks, it is critical to first look at how the overall sector stacks up relative to other sectors in value, momentum, and growth. The table below shows how the sector compares to other sectors in five valuation metrics that have been academically proven to predict returns: (click to enlarge) Source: QuantifiedAlpha.com The utilities sector looks the most attractive of any of the sectors on a book value basis, with the sector’s average price/book ratio of 2.22 being the lowest of any of the sectors. The sector looks relatively attractive on both a revenue and earnings basis, with a sales yield of 49% and earnings yield of 3.6%. Even with the big rally, the average utility stock pays a 3.4% dividend, good for third behind the Energy and Telecom sectors. Undervalued stocks tend to outperform the market, and using the average amount of excess return generated by these factors historically, our algorithms estimate how much. Overall, we expect the average utility stock to generate 1.31% of alpha attributable to value, over the next twelve months. Next, we analyze how the sector is doing on a growth & momentum basis: (click to enlarge) Source: QuantifiedAlpha.com As we said before, the utility sector has performed the best over the last twelve months, gaining 25% on average. It is the second best performing sector over the last six months, behind the Health Care sector, gaining a shade under 9%. The sector falls in the middle of the pack in average annual EPS growth, growing 18%. The sector is also in the middle of the pack in financial efficiency, returning an average of 2.8% on assets and 9.8% on equity. Each of these five metrics has been academically shown to predict stock returns, with the two price momentum metrics being the most important. Overall, we expect the average utility stock to generate 1.33% of alpha attributable to growth over the upcoming twelve months. C) Group Leaders Now that we’ve analyzed the sector on a top-down basis, we’ll now look at which stocks within the electric utility industry group look poised to lead the group. Below is a table showing which stocks in the group are the most undervalued: (click to enlarge) Source: QuantifiedAlpha.com As we can see, our top five most undervalued electrical utilities include Entergy Corporation (NYSE: ETR ), Exelon Corporation (NYSE: EXC ), Portland General Electric Company (NYSE: POR ), American Electric Power Co. (NYSE: AEP ), and Westar Energy (NYSE: WR ). Each of these companies has a sales yield (inverse of Price/Sales) over 45%, which is way above the overall market average. Each of these stocks sport similar earnings and dividend yields, each of which are again much higher than the overall market averages. These stocks also look attractive on a book value basis, with none of the company’s having a price/book ratio over 2. Overall, Entergy tops out as the value leader of the group, with our algorithms expecting the stock to generate 5.8% of value alpha over the next twelve months. With that being said, each of the five stocks is expected to significantly outperform the market due to their attractive value. Next, we’ll see which stocks are leading the sector in growth and momentum: (click to enlarge) Source: QuantifiedAlpha.com As we can see, our top five strongest growth electrical utilities include ITC Holdings Corp. (NYSE: ITC ), Hawaiian Electric Industries (NYSE: HE ), MGE Energy (NASDAQ: MGEE ), Northeast Utilities (NYSE: NU ), and Exelon Corporation. After a slow start to the year, Hawaiian has had a very strong second half of the year (+40%). Exelon has been the best performer over the past year, gaining 44%. Exelon has also had the strong EPS growth of the five, growing annual EPS by 41%. ITC Holdings tops the group in profit efficiency, returning 5.2% on assets and 21% on equity. Overall, ITC is expected to outperform the market the most owing to its growth profile over the upcoming twelve months (4.76%). Exelon is the only stock that made it onto both group leaders lists. Next, we’ll look at which stocks have been performing best relative analyst earnings expectations: (click to enlarge) Source: QuantifiedAlpha.com We’ve found through historical back testing that stocks that beat earnings estimates consistently, are extremely likely to keep beating estimates. This is crucial as stock prices can experience wild swings in price depending on how earnings come out relative to expectations. Hawaiian Electric has the best track record, having beaten EPS estimates by 12% last quarter (6 straight beats) and revenue estimates by 8% (2 straight beats). Edison International (NYSE: EIX ) has the best track record for EPS, having beaten the Wall Street consensus EPS estimates 8 times in a row. PPL Corporation (NYSE: PPL ), Westar Energy, and NextEra Energy (NYSE: NEE ) are names we haven’t seen yet, that have all outperformed expectations as well. D) Conclusion Now that we’ve analyzed the sector as a whole and the individual group leaders in the group, it is time to see which utility stock comes out on top. The table below shows the electric utility stocks we expect to outperform the market the most: (click to enlarge) Source: QuantifiedAlpha.com Exelon comes out on top on our list, with our algorithms expecting the stock to outperform the overall market by 8.73% over the next twelve months. Exelon combines strong value with solid momentum and EPS growth. Entergy, Hawaiian Electric, and Westar Energy are other stocks that were featured earlier in the article that also look very attractive. While American Electric Power is featured at #4 on our overall leader board, we advise investors to stay away from the stock as it has been missing analyst estimates recently (hence the one star Earnings Strength rating). Though the Utility sector outperformed the general market during 2014, we feel the sector is still relatively undervalued and certain names look very attractive.

PPL Corp. To Reward Investors In 2015

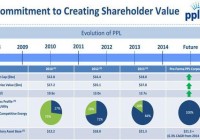
Summary A low treasury yield environment and efforts to reduce competitive energy operations will support PPL’s performance. Efforts to reduce competitive energy operations will positively affect bottom-line numbers and cash flows. PPL is likely to give full-year 2015 earnings guidance during its Q4 2014 earnings call. Utility stocks’ high dividend yields make them attractive investment options for dividend-seeking investors. The utility sector, including PPL Corp. (NYSE: PPL ), performed better than the S&P 500 in 2014. The outperformance of the utility sector was mainly due to the low treasury yield environment. In 2015, I believe PPL will deliver a healthy financial performance due to the ongoing low treasury yield environment and efforts made by the company to lower its competitive energy operations, which will bode well for its EPS. The company has been aggressively working to sell and reduce competitive energy operations, as the competitive energy operations remain challenging. Also, the company offers a healthy dividend yield of 4.3%, supported by its cash flows, which makes it a good investment option for dividend-seeking investors. All Set for 2015 In 2014, the utility sector performed better than the S&P 500. The better performance can be mainly attributed to the low treasury yield environment. In 2015, the utility sector will continue to deliver a healthy performance due to the low yield environment and efforts undertaken by utility companies, including PPL, to reduce their competitive energy operations. The following table shows the performance of the S&P 500, the utility sector ETF (NYSEARCA: XLU ) and PPL. S&P 500 XLU PPL 2014 Performance 12% 25% 22% Source: Bloomberg.com. Due to the weak commodity prices and capacity revenues, competitive energy operations of U.S. utility companies have remained challenging in recent years. In the current environment, utility companies are choosing to reduce their competitive energy operations and making efforts to grow regulated operations. PPL has also been expanding its regulated operations and reducing competitive energy operations, which will positively affect its EPS. The company opted to spin off its competitive energy business operations. The spin-off is expected to be completed in the first half of 2015. The spin-off will allow PPL to focus and expand its regulated business operations. The company is anticipating cost savings of $75 million from the transaction. Also, PPL has finalized a deal to sell its Montana hydro assets to NorthWestern Energy for $0.9 billion . PPL is expected to use cash from the sale to invest in the expansion of its regulated operations. Separately, PPL is taking measures to expand its regulated transmission operations. The company has announced its plans to build a transmission line, and is expected to make capital expenditures of approximately $5 billion over the life of the project. The company has planned to start building the line in 2016-17, and it should be in service by 2023-25. The capital expenditure PPL is planning to make will positively affect its top- and bottom-line growth in the long term. The company will have 100% exposure to regulated business operations in the coming years, which will positively affect its financial performance. The chart below shows that the company has been making consistent and aggressive efforts to reduce its competitive energy operations, and PPL’s regulatory rate base is expected to grow by 6.3% on average from 2014-18. (click to enlarge) Source: Company reports. As the company is expanding its regulated business and is in the planning phase, it will give its 2015 EPS guidance range in the Q4 2015 earnings call next month. Also, the company is likely to update its long-term EPS guidance, which I believe will be in a range of 4%-6%. Along with the earnings growth potential, PPL offers a safe dividend yield of 4.3% , backed by its cash flows. Its attractive dividend yield makes it a good investment for dividend-seeking investors. The company has consistently increased dividends over the years. In the coming years, dividends offered by the company will grow as an increase in its regulated operations will portend well for its bottom-line numbers and cash flows. The following chart shows the dividend per share, dividend payout ratio and dividend coverage ratio for PPL from 2012-2014. (Note * Dividend coverage ratio = operating cash flow/annual dividends, and 2014 figures below are based on estimates). Dividend Per Share ($) Dividend Payout Ratio Dividend Coverage* 2012 $1.44 60% 3.3x 2013 $1.47 60% 3.25x 2014* $1.49 64% 3.2x Source: Company reports and calculations. Conclusion PPL is set to deliver a healthy performance in 2015. The low treasury yield environment and efforts to reduce competitive energy operations will support PPL’s performance in 2015. The company’s efforts to reduce competitive energy operations will positively affect its bottom-line numbers and cash flows. Also, the company is likely to give its full-year 2015 earnings guidance during the Q4 2014 earnings call, which will improve earnings visibility and bode well for the stock price. Also, the stock offers a safe dividend yield of 4.3%. Due to the aforementioned factors, I am bullish on PPL.