Tag Archives: handle

Is Rising Stock Market Volatility Bullish?

By Ronald Delegge When stocks go up, volatility goes down and vice versa. While this historically inverse relationship plays out most of the time, there’s been a significant disconnect as of late. The chart below illustrates this disconnect. As you can see, over the past three months, the S&P 500 (black line) has gained around 2.7% yet the S&P 500 volatility (ChicagoOptions:^VIX) (dotted line) has surged almost 37%. Shouldn’t the VIX be declining when stocks (NYSEARCA: IVV ) are rising? What’s going on? (Audio) Portfolio Report Card: Ron DeLegge Grades a $1.5 Million Portfolio… Pass or Fail? (click to enlarge) On Dec. 17, 2014 via our Weekly ETF Picks we alerted readers about this volatility trend by writing: “Although the S&P 500 volatility index (VIX) has fallen over the past few days, the VIX has been on a tear, gaining almost 40% since early December. Here’s what’s particularly notable about that move: the S&P 500 (SNP:^GSPC) was down only -1.26% over that same time frame! If VIX can soar almost +40% on a -1.25% loss, what type of potential does it have for a sharper pullback? We’re buying the ProShares VIX Short-term Futures ETF (NYSEARCA: VIXY ) and our tandem options trade (for investors that want more leverage) is to buy VIX call options (strike price and monthly expiration reserved for subscribers).” How has it worked out? Thus far, we’ve already bagged a nearly 35% gain on our VIX call options trade and our VIXY trade is ahead by almost 10% since we initiated our trade alert. Bottom line: We interpret the three-month trend of higher stock prices coupled with higher volatility as extremely bullish for long VIX trades. Original Post Disclosure: None Now that you’ve read this, are you Bullish or Bearish on ? Bullish Bearish Sentiment on ( ) Thanks for sharing your thoughts. Why are you ? Submit & View Results Skip to results » Share this article with a colleague

Large-Cap Portfolio Management System With S&P 500 Minimum Volatility Stocks

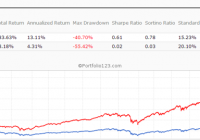
Originally published on Jan. 2, 2015 This R2G model trades in highly liquid large-cap stocks selected from those considered to be minimum volatility stocks of the S&P 500 Index. When adverse stock market conditions exist the model reduces the size of the stock holdings by 60% and buys the -1x leveraged ProShares Short S&P500 ETF (NYSEARCA: SH ). It produced a simulated survivorship bias free average annual return of about 36% from Jan-2000 to end of Dec-2014. Minimum volatility stocks should provide exposure to the stock market with potentially less risk, seeking to benefit from what is known as the low-volatility anomaly . Consequently, they should show reduced losses during declining markets, but should also show lower gains during rising markets. However, our backtests show that better returns than the broader market can be obtained under all market conditions by selecting 8 of the highest ranked stocks of a universe made up from minimum volatility stocks of the S&P 500. Minimum volatility stock universe of the S&P 500 By definition, minimum volatility stocks should exhibit lower drawdowns than the broader market and show reasonable returns over an extended period of time. It was found that a universe of stocks mainly from the Health Care, Consumer Staples and Utilities sectors satisfied those conditions. This minimum volatility universe of the S&P 500 currently holds 119 large-cap stocks (market cap ranging from $4- to $295-billion), and there were 111 stocks in the universe at the inception of the model, on Jan-2-2000. Performance of all the stocks in the universe from 2000 to 2014 The backtest period was 15 years, from January 2000 to December 2014. The backtest simulates holding all stocks of the universe equal weight and rebalancing every week to equal weight. Dividends are included in the stock price data, and are therefore accounted for in the backtest. The maximum drawdown during the backtest period would have been 40.7%, considerably less than the 55.4% for SPY , the SPDR S&P 500 ETF Trust. Annualized return (CAGR) of 13.1% was also considerably better than the 4.3% for SPY. (click to enlarge) (click to enlarge) Performance of all the stocks in the universe during up-market conditions The period March 2009 to December 2014 qualifies as an up-market period. The maximum drawdown would have been 14.9%, less than the 20.1% for SPY. The backtest shows an annualized return of 25.0%, marginally better than the 21.3% for SPY. (click to enlarge) (click to enlarge) The Best8(S&P500 Min-Volatility) model One can see from the above analysis that our S&P 500 minimum volatility stock universe provided better returns than what is expected from minimum volatility ETFs, showing less drawdown during declining markets, but also exhibiting gains during rising markets, similar to, or better than, the broader market. Therefore this universe provides the basis for periodically selecting the highest ranked 8 stocks according to a ranking system. Ranking System To find stocks which may be undervalued, all stocks of the S&P 500 point-in-time minimum volatility stock universe were ranked weekly according to the following parameters: Valuation (measured as market capitalization, debt and cash relative to earnings before interest, taxes, depreciation & amortization, future cash flow and projected earnings), Efficiency (measured as future cash flow relative to total assets), Financial Strength (measured as future cash flow relative to total debt), Short Interest (being the short interest ratio), Trend (measured as the stock price relative to a moving average of the price), with the highest rank obtainable being 100. To test the effectiveness of the ranking system, the universe was divided into 15 “buckets”, each holding about 8 stocks and performance was tested over 15 years. One can see that the “bucket” on the very right with the highest ranks also shows the highest annualized return of about 23%. (Note, there are no buy- and sell-rules in the ranking system.) Trading Rules The model assumes stocks to be bought and sold at the next day’s closing price after a signal is generated. Variable slippage accounting for brokerage fees and transaction slippage were taken into account. (See the Appendix for variable slippage.) Taxes are assumed to be deferred, as for retirement accounts. Buy Rules: Short Interest Ratio < 2.8, and exclude some of the largest market cap stocks from being selected. Sell Rules: Performance In the figures below the red graph represents the model and the blue graph shows the performance of benchmark SPY. Figures 1, 2 and 3 show performance comparisons: Figure 1: Performance 2000-2014 and hedging with SH. The model reduces the size of the stock holdings by 60% to buy SH during down-market conditions. (Note: The inception date of SH was June 19, 2006. Prior to this date values are “synthetic”, derived from the S&P 500.) Annualized Return= 36.3%, Max Drawdown= -24.0%. Figure 2: Performance 2000-2014 without hedging. Annualized Return= 25.6%, Max Drawdown= -51.7%. Figure 3: Performance 2009-2014 without hedging. Annualized Return= 42.6%, Max Drawdown= -17.3%. (click to enlarge) (click to enlarge) (click to enlarge) (click to enlarge) (click to enlarge) (click to enlarge) Figures 4 to 8 show performance details: Figure 4: Performance 2000-2014 versus SPY. Over the 15-year period $100 invested at inception would have grown to $10,368, which is 56-times what the same investment in SPY would have produced. Figure 5: 1-year returns. Except for 2006 the 1-year returns were always higher than for SPY. There was never a negative return over one calendar year. Figure 6: 1-year rolling returns. The minimum 1-year rolling return of the 3-day moving average was -3.1% early in 2009. Figure 7: Distribution of monthly returns. One can see that the monthly returns follow a normal distribution, displaced to the right relative to the returns of SPY. Figure 8: Risk measurements for 15-year and trailing 3-year periods. (click to enlarge) (click to enlarge) (click to enlarge) (click to enlarge) Liquidity To calculate the maximum dollar-value of a portfolio without incurring too much slippage the following formula was provided by P123: ($LiquidityBottom20Pct * #Position * 5%) / WeeklyTurnover% where 5% is the maximum amount traded without affecting the stock price. $LiquidityBottom20Pct = $ 16.8-million #Positions = 8 Annual Turnover% = 430% WeeklyTurnover% = 8.3% Maximum Portfolio Size = ($16.8 * 8 * 5%) / 8.3% = $80-million Thus, this model could accommodate a good number of individual investors. Variable Slippage The model assumes that stocks are bought/sold at the next day’s closing price after the signal is generated. Since one may not be able to obtain the closing price, a slippage factor is applied to account for a possible higher/lower price for the transactions. The slippage percentage is calculated for every transaction based on this algorithm: 1) The 10 day average of the daily traded $-amount is calculated (price*volume). 2) The slippage is set according to where the average falls in this table: 0 – $50K 5.00% $50K – $100K 1.50% $100K – $350K 0.75% $350K – $1M 0.50% $1M – $5M 0.25% $5M+ 0.10% 3) Add (1/ Price)% to the result from Step 2. For example, Step 3 would add 1% to the slippage if the stock trades at $1, 0.1% if it trades at $10, etc. For the following transaction Date Symbol Type Shares Trading Volume on day Price excluding slippage 5/28/2013 XXX BUY 64,108 3,338,776 50.27 the slippage percentage would be (0.10 + 1/50.27) = 0.120% of $50.27, amounting to about 6 cents per share. So the average price per share paid for this transaction is $50.33.

Minimum Volatility Stocks: Out-Of-Sample Performance Of USMV Buy & Hold Models

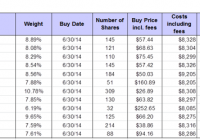
Originally published on Dec. 16, 2014 The backtest reported in this article showed that ranking the holdings of USMV , the iShares MSCI USA Minimum Volatility ETF, and selecting a portfolio of the 12 top ranked stocks, provided higher returns for the buy & hold portfolio than for the underlying ETF. To test these findings out-of-sample we launched the Best12[USMV]-July-2014on Jun-30-2014 and the first sister model Best12[USMV]-Oct-2014 on Sep-29-2014. Holdings and performance have been published weekly on our website since then. So far to Dec-15-2014 these portfolios have gained 19.2% (6.8%) and 10.5% (5.3%), respectively. (USMV gains are in brackets.) The test will be expanded by the launch on Jan-5-2015 of the second of the three sister models quarterly displaced, the Best12[USMV]-Jan-2015, which again will consist of the 12 highest ranked stocks of the then point-in-time holdings of USMV. Eventually there will be four quarterly displaced Best12[USMV] models at iMarketSignals to check whether the out-of-sample [OOS] performances of the models exceed those of USMV over the same periods. Only when the OOS periods are long enough can one decide whether this is a profitable investment strategy. One can probably assume this to be the case if by the end of next year the combined returns of the models are indeed significantly higher than the combined returns of USMV for the corresponding periods. Although the performance of the two models have been considerably better than that of USMV, one should not commit capital in the expectation that strategies that worked well in-sample, and for a few months OOS, are therefore also bound to do well in the future. Backtest Parameters It is relatively simple to “overfit” an investment strategy so that it performs well in-sample, but the more complex a model is, the higher the likelihood of the OOS performance to underperform the backtest’s results. Therefore a simple algorithm with only a few parameters was chosen, with buy- and sell rules kept to a minimum, details of which were provided in the original article. The model should also be tax-efficient because the holding period for each stock will normally be at least one year long. Current Holdings and Return to Dec-15-2014 for Best12[USMV]-July-2014 Of the portfolio’s initial holdings of 12 stocks, 11 of them gained value since inception on Jun-30-14, with the portfolio showing a 19.23% return to Dec-15, while iShares’ USMV gained 6.77% over the same period. A starting capital of $100,000 at inception grew to $119,230, with fees and slippage accounted for. Table 1 below shows the current holdings, unchanged since inception, and return for each position. (click to enlarge) (click to enlarge) The performance graphs of $100 invested in the Best12[USMV] and SPY (the ETF tracking the S&P500), is shown below, with the red graph indicating the value of Best12[USMV]-July-2014 and the blue graph depicting the value of SPY. (click to enlarge) (click to enlarge) Current Holdings and Return to Dec-15-2014 for Best12[USMV]-Oct-2014 Of the portfolio’s initial holdings of 12 stocks, 11 of them gained value since inception on Sep-29-14, with the portfolio showing a 10.53% return to Dec-15, while iShares’ USMV gained 5.30% over the same period. A starting capital of $100,000 at inception grew to $110,530, with fees and slippage accounted for. Table 2 below shows the current holdings, unchanged since inception, and return for each position. (click to enlarge) (click to enlarge) The performance graphs of $100 invested in the Best12[USMV] and SPY (the ETF tracking the S&P500), is shown below, with the red graph indicating the value of Best12[USMV]-July-2014 and the blue graph depicting the value of SPY. (click to enlarge) (click to enlarge) Following the Models At our website, the weekly performance update could be followed already from July 2014 onward. It was originally predicted that a 12-stock model should outperform USMV, which the results of the July and October models so far confirm. (The weekly updates can also be viewed by non-subscribers to iM in the archive section, delayed by a few weeks.) To track performance over an extended OOS period we will be adding, additional to the Jul-2014 and Oct-2014 models, another two similar models, the Jan-2015 and Apr-2015 models. At inception each model will have a 12-stock portfolio selected from the point-in-time holdings of USMV. The universe from which stocks are selected will be updated every three months for each model with the universe corresponding to the then current holdings of USMV. Current holdings of the models, which may not be included in the new universe, will be added to the universe. This will ensure that stocks are not sold because they may be omitted from future holdings of USMV, and the models can keep their holdings for at least one year as stipulated by the sell rules. It is expected that by April 2015 the combined stock holdings of the four models will be about 20% of the holdings of USMV, about 30 different stocks. The portfolio is expected to show better returns than USMV, provided that the OOS performance continuous to confirm the backtest’s results. Appendix Combined Holdings The combined models hold 18 different stocks of which 6 are represented in both models as shown in the table below. Combined Holdings of Best12(NYSEARCA: USMV )-July and Best12( USMV )-Oct Ticker Nr. of times in combination Sector AZO 1 Consumer Discretionary BBBY 1 Consumer Discretionary DG 2 Consumer Discretionary DLTR 1 Consumer Discretionary ROST 1 Consumer Discretionary CVS 1 Consumer Staples PRE 1 Financials TRV 1 Financials Y 1 Financials CAH 2 Health Care ESRX 1 Health Care MDT 1 Health Care LMT 1 Industrials LUV 2 Industrials MMM 1 Industrials PCP 2 Industrials EBAY 2 Information Technology SNPS 2 Information Technology