Tag Archives: function

Be Knowledgeable About Liquidity, Don’t Get Fooled By KNOW
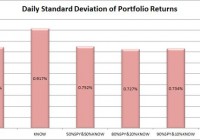
Summary I’m taking a look at KNOW as a candidate for inclusion in my ETF portfolio. The average volume looks high enough that the low correlation would seem reliable. Checking the historical data on volume shows that there were a striking number of days with no trades recorded. Despite the interesting concept and strong returns so far, I’m not fond of a very high expense ratio being combined with an ETF that frequently sees a volume of 0. I’m not assessing any tax impacts. Investors should check their own situation for tax exposure. How to read this article : If you’re new to my ETF articles, just keep reading. If you have read this intro to my ETF articles before, skip down to the line of asterisks. This section introduces my methodology. By describing my method initially, investors can rapidly process each ETF analysis to gather the most relevant information in a matter of minutes. My goal is to provide investors with immediate access to the data that I feel is most useful in making an investment decision. Some of the information I provide is readily available elsewhere, and some requires running significant analysis that, to my knowledge, is not available for free anywhere else on the internet. My conclusions are also not available anywhere else. What I believe investors should know My analysis relies heavily on Modern Portfolio Theory. Therefore, I will be focused on the statistical implications of including a fund in a portfolio. Since the potential combinations within a portfolio are practically infinite, I begin by eliminating ETFs that appear to be weak relative to the other options. It would be ideal to be able to run simulations across literally billions of combinations, but it is completely impractical. To find ETFs that are worth further consideration I start with statistical analysis. Rather than put readers to sleep, I’ll present the data in charts that only take seconds to process. I include an ANOVA table for readers that want the deeper statistical analysis, but readers that are not able to read the ANOVA table will still be able to understand my entire analysis. I believe there are two methods for investing. Either you should know more than the other people performing analysis so you can make better decisions, or use extensive diversification and math to outperform most investors. Under CAPM (Capital Asset Pricing Model), it is assumed every investor would hold the same optimal portfolio and combine it with the risk free asset to reach their preferred spot on the risk and return curve. Do you know anyone that is holding the exact same portfolio you are? I don’t know of anyone else with exactly my exposure, though I do believe there are some investors that are holding nothing but SPY. In general, I believe most investors hold a portfolio that has dramatically more risk than required to reach their expected (under economics, disregarding their personal expectations) level of returns. In my opinion, every rational investor should be seeking the optimal combination of risk and reward. For any given level of expected reward, there is no economically justifiable reason to take on more risk than is required. However, risk and return can be difficult to explain. Defining “Risk” I believe the best ways to define risk come from statistics. I want to know the standard deviation of the returns on a portfolio. Those returns could be measured daily, weekly, monthly, or annually. Due to limited sample sizes because some of the ETFs are relatively new, I usually begin by using the daily standard deviation. If the ETF performs well enough to stay on my list, the next levels of analysis will become more complex. Ultimately, we probably shouldn’t be concerned about volatility in our portfolio value if the value always bounced back the following day. However, I believe that the vast majority of the time the movement today tells us nothing about the movement tomorrow. While returns don’t dictate future returns, volatility over the previous couple years is a good indicator of volatility in the future unless there is a fundamental change in the market. Defining “Returns” I see return as the increase over time in the value known as “dividend adjusted close”. This value is provided by Yahoo. I won’t focus much on historical returns because I think they are largely useless. I care about the volatility of the returns, but not the actual returns. Predicting returns for a future period by looking at the previous period is akin to placing a poker bet based on the cards you held in the previous round. Defining “Risk Adjusted Returns” Based on my definitions of risk and return, my goal is to maximize returns relative to the amount of risk I experienced. It is easiest to explain with an example: Assume the risk free rate is 2%. Assume SPY is the default portfolio. Then the risk level on SPY is equal to one “unit” of risk. If SPY returns 6%, then the return was 4% for one unit of risk. If a portfolio has 50% of the risk level on SPY and returns 4%, then the portfolios generated 2% in returns for half of one unit of risk. Those two portfolios would be equal in providing risk adjusted returns. Most investors are fueled by greed and focused very heavily on generating returns without sufficient respect for the level of risk. I don’t want to compete directly in that game, so I focus on reducing the risk. If I can eliminate a substantial portion of the risk, then my returns on a risk adjusted basis should be substantially better. Belief about yields I believe a portfolio with a stronger yield is superior to one with a weaker yield if the expected total return and risk is the same. I like strong yields on portfolios because it protects investors from human error. One of the greatest risks to an otherwise intelligent investor is being caught up in the mood of the market and selling low or buying high. When an investor has to manually manage their portfolio, they are putting themselves in the dangerous situation of responding to sensationalistic stories. I believe this is especially true for retiring investors that need money to live on. By having a strong yield on the portfolio it is possible for investors to live off the income as needed without selling any security. This makes it much easier to stick to an intelligently designed plan rather than allowing emotions to dictate poor choices. In the recent crash, investors that sold at the bottom suffered dramatic losses and missed out on substantial gains. Investors that were simply taking the yield on their portfolio were just fine. Investors with automatic rebalancing and an intelligent asset allocation plan were in place to make some attractive gains. Personal situation I have a few retirement accounts already, but I decided to open a new solo 401K so I could put more of my earnings into tax advantaged accounts. After some research, I selected Charles Schwab as my brokerage on the recommendation of another analyst. Under the Schwab plan “ETF OneSource” I am able to trade qualifying ETFs with no commissions. I want to rebalance my portfolio frequently, so I have a strong preference for ETFs that qualify for this plan. Schwab is not providing me with any compensation in any manner for my articles. I have absolutely no other relationship with the brokerage firm. Because this is a new retirement account, I will probably begin with a balance between $9,000 and $11,000. I intend to invest very heavily in ETFs. My other accounts are with different brokerages and invested in different funds. Views on expense ratios Some analysts are heavily opposed to focusing on expense ratios. I don’t think investors should make decisions simply on the expense ratio, but the economic research I have covered supports the premise that overall higher expense ratios within a given category do not result in higher returns and may correlate to lower returns. The required level of statistical proof is fairly significant to determine if the higher ratios are actually causing lower returns. I believe the underlying assets, and thus Net Asset Value, should drive the price of the ETF. However, attempting to predict the price movements of every stock within an ETF would be a very difficult and time consuming job. By the time we want to compare several ETFs, one full time analyst would be unable to adequately cover every company. On the other hand, the expense ratio is the only thing I believe investors can truly be certain of prior to buying the ETF. Taxes I am not a CPA or CFP. I will not be assessing tax impacts. Investors needing help with tax considerations should consult a qualified professional that can assist them with their individual situation. The rest of this article By disclosing my views and process at the top of the article, I will be able to rapidly present data, analysis, and my opinion without having to explain the rationale behind how I reached each decision. The rest of the report begins below: ******** (NYSEARCA: KNOW ): Direxion All Cap Insider Sentiment Shares Tracking Index: Sabrient Multi-Cap Insider/Analyst Quant-Weighted Index Allocation of Assets: At least 80% within the index Morningstar® Category: Mid-Cap Blend Time period starts: April 2012 Time period ends: December 2014 Portfolio Std. Deviation Chart: (click to enlarge) (click to enlarge) Correlation: 62.75% Returns over the sample period: (click to enlarge) Liquidity (Average shares/day over last 10): About 10,000 Days with no change in dividend adjusted close: 180 Days with no change in dividend adjusted close for SPY: 5 Yield: 1.13% Distribution Yield Expense Ratio: Gross 1.69% and Net 0.65% Discount or Premium to NAV: 0.06% premium Holdings: (click to enlarge) Further Consideration: Yes Conclusion: KNOW is a very interesting and aptly named ETF. The ETF is investing by tracking movements by insiders. It is an interesting strategy and an ETF that automates the strategy may provide much lower costs than an investor attempting to use the strategy by themselves. While I’m not convinced that the strategy works any better than holding SPY, I find the idea of doing it through an ETF novel so I will keep it on the list. If there is actually a lower correlation because of movements in the positions it could be a useful ETF under modern portfolio theory. However, despite an average trading volume of over 10,000 shares, there were 180 days with no change in the dividend adjusted close. I thought that was strange so I ran a volume test over the period checking for days in which 0 shares were traded. There were 174 days in which that happened. That reinforces the theory that despite decent trading volumes in the average over the last 10 days, the calculated correlation has been dramatically altered by liquidity that is much worse than it would have seemed at first glance. In this case I would advise investors to be very wary of relying on the average volume as a sole indicator of liquidity. The distribution yield may be subject to change as the holdings of the ETF change, so I wouldn’t recommend this for anyone needing a consistent yield out of their portfolio. As any of my frequent readers know, I won’t be a fan of the expense ratio. I recognize that the ETF may have significantly more trading costs to cover because of their strategy, but I don’t like seeing values that are so high. The net expense ratio is substantially below the gross expense ratio because of waivers and reimbursement policies in place through September 1st, 2015. I can deal with poor liquidity in the sense of weak average volume, but the frequency of a recorded volume of 0 combined with the expense ratios make it unlikely that KNOW will survive the next round of cuts, even though I’m putting it through to the second round for now. Additional disclosure: Information in this article represents the opinion of the analyst. All statements are represented as opinions, rather than facts, and should not be construed as advice to buy or sell a security. Ratings of “outperform” and “underperform” reflect the analyst’s estimation of a divergence between the market value for a security and the price that would be appropriate given the potential for risks and returns relative to other securities. The analyst does not know your particular objectives for returns or constraints upon investing. All investors are encouraged to do their own research before making any investment decision. Information is regularly obtained from Yahoo Finance, Google Finance, and SEC Database. If Yahoo, Google, or the SEC database contained faulty or old information it could be incorporated into my analysis. The analyst holds a diversified portfolio including mutual funds or index funds which may include a small long exposure to the stock.
Energy ETF: XLE No. 9 Select Sector SPDR In 2014

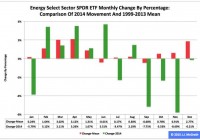
Summary The Energy exchange-traded fund finished ninth by return among the nine Select Sector SPDRs in 2014. The ETF was extraordinarily strong in the first half and even more extraordinarily weak in the second half. Seasonality analysis may be irrelevant until the commodity price of crude oil shows signs of stability. The Energy Select Sector SPDR ETF (NYSEARCA: XLE ) in 2014 ranked No. 9 by return among the Select Sector SPDRs that split the S&P 500 into nine segments. On an adjusted closing daily share-price basis, XLE dipped to $79.16 from $86.68, a drop of -$7.52, or -8.68 percent. As a result, it behaved worse than its sibling, the Utilities Select Sector SPDR ETF (NYSEARCA: XLU ) and parent proxy, the SPDR S&P 500 Trust ETF (NYSEARCA: SPY ) by -37.41 and -22.14 percentage points, in that order. (XLE closed at $72.86 Thursday.) XLE also ranked No. 9 among the sector SPDRs in the fourth quarter, when it performed worse than XLU and SPY by -25.29 and -17.00 percentage points, respectively. And XLE ranked No. 5 among the sector SPDRs in December, when it led SPY by 0.04 percentage point and lagged XLU by -3.79 points. Figure 1: XLE Monthly Change, 2014 Vs. 1999-2013 Mean (click to enlarge) Source: This J.J.’s Risky Business chart is based on analyses of adjusted closing monthly share prices at Yahoo Finance . XLE behaved a lot worse in 2014 than it did during its initial 15 full years of existence based on the monthly means calculated by employing data associated with that historical time frame (Figure 1). The same data set shows the average year’s weakest quarter was the third, with a relatively small negative return, and its strongest quarter was the first, with an absolutely large positive return. Inconsistent with its pattern last year, the ETF had a little gain in Q1, a big gain in Q2 and big losses in Q3 and Q4. Figure 2: XLE Monthly Change, 2014 Versus 1999-2013 Median (click to enlarge) Source: This J.J.’s Risky Business chart is based on analyses of adjusted closing monthly share prices at Yahoo Finance. XLE also performed a lot worse in 2014 than it did during its initial 15 full years of existence based on the monthly medians calculated by using data associated with that historical time frame (Figure 2). The same data set shows the average year’s weakest quarter was the second, with a relatively small positive return, and its strongest quarter was the third, with an absolutely large positive return. Meanwhile, I suspect seasonality analysis may be irrelevant until the commodity price of crude oil displays signs of stability. Figure 3: XLE’s Top 10 Holdings and P/E-G Ratios, Jan. 15 (click to enlarge) Notes: 1. “NA” means “Not Available.” 2. The XLE holding-weight-by-percentage scale is on the left (green), and the company price/earnings-to-growth ratio scale is on the right (red). Source: This J.J.’s Risky Business chart is based on data at the XLE microsite and Yahoo Finance (both current as of Jan. 15). With the possible exception of Schlumberger Ltd. (NYSE: SLB ), XLE’s top 10 holdings appear to range from fairly valued to overvalued (Figure 3). However, the numbers on the S&P 500 energy sector reported by S&P Senior Index Analyst Howard Silverblatt Dec. 31 indicated its valuation seems comparatively reasonable, with its P/E-G ratio at 1.16. Speaking of Schlumberger, the 2014 financial report it released Thursday was replete with evidence of the effects that the cratering in the commodity price of crude oil has had on the company in particular and, by extension, on the energy sector in general. Here are three of the highlights, or lowlights, of the report: [1] Although the functional currency of Schlumberger’s operations in Venezuela is the U.S. dollar, a portion of the transactions are denominated in local currency. Schlumberger has historically applied the official exchange rate of 6.3 Venezuelan Bolivares fuertes per U.S. dollar to remeasure local currency transactions and balances into U.S. dollars. Effective December 31, 2014, Schlumberger concluded that it was appropriate to apply the … exchange rate of 50 Venezuelan Bolivares fuertes per U.S. dollar as it believes that this rate best represents the economics of Schlumberger’s business activity in Venezuela. As a result, Schlumberger recorded a $472 million devaluation charge. [2] In response to lower commodity pricing and anticipated lower exploration and production spending in 2015, Schlumberger decided to reduce its overall headcount to better align with anticipated activity levels for 2015. Schlumberger recorded a $296 million charge associated with a headcount reduction of approximately 9,000. [3] Schlumberger determined that, primarily as a result of the recent decline in commodity prices, the carrying value of its investment in [a Schlumberger Production Management] development project in the Eagle Ford Shale was in excess of its fair value. Accordingly, Schlumberger recorded a $199 million impairment charge. I suspect many other energy-sector firms will be making similar announcements in the weeks, months and quarters to come. Figure 4: EUR/USD, Crude Oil And XLE, 2014 Daily Prices (click to enlarge) Note: The crude-oil and XLE scale is on the left, and the EUR/USD scale is on the right. Source: This J.J.’s Risky Business chart is based on analyses of adjusted closing daily share prices of XLE reported by Yahoo Finance ; closing daily prices of the New York Mercantile Exchange’s Cushing, OK Crude Oil Future Contract 1 reported by the U.S. Energy Information Administration ; and daily foreign-exchange rates of the euro/U.S. dollar, or EUR/USD, currency pair reported by the Federal Reserve Economic Data site of the Federal Reserve Bank of St. Louis. As indicated previously , I believe XLE’s upward movement in the first half of last year was primarily driven by market participants’ concern about the battle over control of Middle Eastern crude-oil assets between Islamic State of Iraq and the Levant, or ISIL, fighters on the one side and Iraqi government, Kurdish and aligned forces on the other side. I think the ETF’s downward movement since then has been primarily driven by market participants’ concern about the battle over monetary policy between major central banks: The U.S. Federal Reserve is oriented toward tightening, while the Bank of Japan, European Central Bank and People’s Bank of China all are oriented toward loosening. This bias divergence at the biggest central banks in the world already has had major effects on multiple markets, ranging from currencies (e.g., the euro/U.S. dollar cross, or EUR/USD) to commodities (e.g., crude oil) to the energy sector of the equity market (e.g., XLE), as suggested by Figure 4. Along this line, the amazing disappearance of about 18.79 percent in the euro/Swiss franc cross, or EUR/CHF, Thursday was but the latest manifestation of the wobbles in financial markets around the world. Measured by the daily prices of the components of the above chart, the EUR/USD currency pair peaked at $1.3927 March 13 (revisiting the area May 6), crude oil per barrel peaked at $107.26 June 20 and XLE per share peaked at $100.77 June 23. Their respective declines since then are clearly related, statistically speaking. Their lockstep movements appear likely to continue unless the Federal Open Market Committee makes clear it will delay the anticipated announcement of its interest-rate hikes April 29 and that it is preparing to carry out asset purchases under its fourth formal quantitative-easing program of the 21st century, aka QE4. The FOMC may be hard-pressed to present a convincing rationale for those actions, given the conditions described in “SPY Slips And U.S. Economic Index Slides In December.” But, without them, XLE may continue to be the equivalent of a canary in coal mine where things are looking darker by the day. Disclaimer: The opinions expressed herein by the author do not constitute an investment recommendation, and they are unsuitable for employment in the making of investment decisions. The opinions expressed herein address only certain aspects of potential investment in any securities and cannot substitute for comprehensive investment analysis. The opinions expressed herein are based on an incomplete set of information, illustrative in nature, and limited in scope. In addition, the opinions expressed herein reflect the author’s best judgment as of the date of publication, and they are subject to change without notice.

10 Reasons Why Every Serious Investor Should Read Barrons

All serious investors investing for their future should subscribe to and read this weekly newspaper. Barrons is an antidote to main-stream financial news media that carries articles with screaming headlines of euphoria or disaster that intimidates investors. Barrons uses analysis and facts in addition to speaking with some of the most respected investors on Wall Street when setting out their opinions. Barrons follows up their stock picks periodically with continued analysis as to why they were right or wrong in addition to whether such picks are still valid. Barrons provides information, market data and columns covering all aspects of the U.S. economy and markets, world markets and other useful commentary. Many years ago we knew someone who was an equity-derivatives trader on Wall Street. That trader, who made almost $1 million in a year at the age of 27, told us we should read The Economist and Barrons each week. We read The Economist for a year or so, but the volume of reading required each week was overwhelming. Then, however, we started reading Barrons and we have never stopped. Barrons’ regular subscription cost is about $200 a year, but the publisher is always running special subscription offers. Currently an investor can obtain their first 26 weeks for $1 a week. We purchased our current Barrons subscription using 1900 airline miles. However you pay for Barrons, we believe all that serious investors investing for their future should subscribe to and read this weekly newspaper that arrives on Saturday mornings. We are not alone in our appreciation for Barrons. Here are some other articles discussing why Barrons is a valuable financial resource and how a reader should use the information contained within. Why we read Barrons generally As readers of our articles know, we do not look highly upon the most mainstream of financial-news-media outlets. Mainstream financial news media includes CNBC, Fox Business News and any news feed Internet financial web site that carries articles with screaming headlines of euphoria or disaster. Such mainstream financial media is not designed to truly help individual investors in a calm and sober manner. Rather, such mainstream financial news is designed to attain large viewership numbers. In our minds, mainstream financial media is on par with tabloid journalism. Harsh? Yes, but all too true. Barrons is different in that whether their news is bullish or bearish, they do not hit the reader over the head with histrionic language. Rather, Barrons uses analysis and facts in addition to speaking with some of the most respected investors on Wall Street when setting out their opinions. In addition, they have cartoons on par with New Yorker magazine to make you smile even when your recent investment performance is making you frown. In this article, we will briefly discuss why we read Barrons specifically. 1 – Up and Down Wall Street This article basically outlines the mood of overall markets, world economies and politics. This section is valuable to establish an overall investment mood for readers. This article typically starts with outlining the previous week’s trading and then interweaves economic data, political news both American and Foreign, significant events and commentary by well-known Wall Street players to establish a current mood for past week of trading and the mood that may lead off the upcoming week of trading. Reading this article is a must. 2 – Follow up to Barrons stock picks One thing you will rarely if ever see in the majority of financial publications is a follow up to buy and sell recommendations with regard to individual stocks, industry-related groups of stocks or overall market calls. Barrons is different. Barrons periodically reviews their stock picks whether they were good or bad calls. In a Barrons follow up, they will either say why a stock continues to be a buy, sell or whether their opinion has changed based on intervening news and set out an explanation for their opinion. Accountability for opinions is a rare commodity, and Barrons willingness to stand behind their successes and failures gives us confidence to consider and act on future Barrons recommendations. 3 – The Trader This article generally begins sets out the recent week’s movements in the market indexes by the numbers and ties in news related events that may have moved the markets up or down. Quotes from well-known Wall Street veterans are frequently set out in the beginning of this article. As this article moves forward there are usually one or two specific stock recommendations that a reader may further research and then act upon. Overall this article is one we read every week. 4 – Insider Transaction filings This section, while small, sets out a small but useful section of the top 20 largest insider buys and sales for the week along with an insider transactions ratio. Although insider transactions are available in many places, we like that the information is gathered all in one small place. In addition, the insider transaction ratio is a chart that indicates whether an overall market mood is bullish or bearish based on recent insider activity. We have used this tiny section successfully as a partial basis for some of our past investment decisions. 5 – Speaking of Dividends This article is valuable in that it recounts the previous week’s dividend activity such as dividend increases, reductions or special dividends. When the previous week did not have a significant amount of dividend news, this article recounts dividend trends in the overall markets that are valuable to consider for any dividend investor. 6 – Market Laboratory Barrons is old school so to speak in that it still gathers a significant amount of economic, commodity, market index, short interest, individual stock, dividend, bond, currency, foreign market and earnings calendar data. While a reader may be able to find much of this data in other places on the Internet, in Barrons, it is all in one place. Not all of the information will be valuable to every reader. We like the earnings calendar announcements, short interest tables, weekly new high/low tables, dividend data and research reports. 7 – 13D Filings A 13D filing is a filing with the Securities and Exchange within 10 days of attaining a greater than 5 percent position of a company’s securities. This information is valuable to investors interested in high or low profile investment stakes built up in a particular company’s stock by an investment entity such as an investment group. 8 – Weekly stock profiles This article or group of articles profiles one or two stocks a week in the small, medium and large capitalization range that provides a valuable starting point for an investor to research new investment ideas. Be careful of buying too quickly though as Barrons profile articles are known to provide a bounce in a profiled company’s stock in the week or so following the profile. A profile of a stock an investor already owns is still valuable as such profile provides a continued thesis for holding a stock into the future. 9 – The weekly headline article The weekly headlines article may focus on individual stocks, industry stocks, mutual funds, economic trends, various economies around the world. This headline article may not always be of interest to a reader but still should be read for the sake of deepening one’s knowledge in regard to various topics as they relate to the U.S. or world economies. 10 – Everything else Not everything in Barrons will interest a reader, but for the sake of completeness and increasing knowledge a reader should try to read most of the articles and columns which tend to run one page or less. There is: 1) Editorial Commentary by Thomas Donlan which tends to express his quite conservative views about politics, business and the economy; 2) D.C. Current by Jim McTague which focuses on American politics and the business world also with a conservative viewpoint; 3) CEO spotlight which focuses on the CEO of a company and their life and the performance and future direction of the company the CEO heads; 4) Technology week which we believe is one of the weakest links in Barrons as this column gushes over Apple, Inc. (NASDAQ: AAPL ) on a seemingly weekly basis; 5) the European Trader, Asian Trader, Emerging Markets and Commodities Corner columns; 6) Current Yield which focuses on bonds; 7) a mutual fund or investment group and their investments along with their outlook for the U.S. and world economies; and 8) Striking Price which focuses on the options market and market volatility. There is more, but to keep this article brief we have set forth the highlights of Barrons. Conclusion We have noticed that many people who have attained some form of monetary “success” either through their own efforts or inheritance read Barrons. We read it because their analysis is intelligent, informed and rational. The articles contained within Barrons address an investor with respect and do not scream their opinions to gain attention. Barrons, however, with their long and storied history is respected, incisive, listened to and quoted on a weekly basis year after year. As such, every investor who seriously wants to succeed for their own well being should read it regularly.