Tag Archives: function

Tax-Loss Harvest Swap – A Prudent Move For Energy Investors

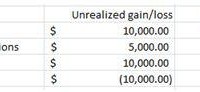
Summary In this article, we will discuss a popular tax strategy called a “loss-harvest swap”. This is effectively a legal version of the SEC-outlawed “wash-sale”. This is particularly relevant for investors with current unrealized losses in energy companies. A tax-loss harvest swap works well in times of indiscriminate selling within a sector, such as the recent selloff in oil. Whenever there are substantially alike securities to “swap” one position for another, this strategy can work well. The strategy also works well (better in fact) with ETFs. Loss-Harvest Swap Example Take this example portfolio. You’ll see we have some unrealized losses in Ultra Petroleum, a small-cap E&P company. Since the broad selloff in energy, many small-cap E&Ps have gone on sale. There are several which have fallen more than UPL and which we wouldn’t mind owning instead of it now. Say our swap of choice is SWN , a larger E&P trading at a similar valuation of 3.5x trailing cash flow, and more stable long-term Marcellus acreage. The stock has fallen 39% over the past year, compared to UPL’s 35%. A loss-harvest swap calls for a sale of UPL and a buy of SWN. From a portfolio standpoint, my risk / reward would be basically unchanged – I am still long a small-cap E&P company that is substanitally correlated to the sector. I might eventually end up with more gains from SWN than UPL, or less – that is a risk. But, I also generate some immediate & guarranteed tax benefits. Tax Savings The exact amount of the tax savings depends on your tax bracket: The savings vary, but the point is that these tax savings were obtained without much risk, and are essentially free money. If you have some short term capital gains, this is pure gold. Also, if your realized losses exceed your realized gains for the year, one can use $3000 of the losses to reduce one’s taxable income, and carry over the rest to next year. How Often to Harvest Losses Tax-loss harvesting is a strategy that can be used fairly often. Taking trading commissions into account as a cost, and leaving some margin for error for divergence between your swapped securities’ returns (don’t want inadvertently destroy alpha by buying an inferior name), you could easily make the case for an automatic swap at set thresholds (for example- harvest at every 5% loss). As such, you could benefit from even minor market volatility after you buy– and lock in a lower cost basis. However, swapping more often will generate trading costs, so I recommend using a discounted broker such as Interactive Brokers or Optionshouse (these are two I have used in the past). Also, keep in mind tax strategy is not a substitute for a good investment strategy – make sure you have the latter in place first. For a stock or sector that keeps falling, using 2 substantially-alike securites, one can swap one for the other once every 31 days and still remain in the clear with respect to the SEC’s wash sale rules. Using 3 alike securities, such as 3 ETFs which track the same index (yes, that is still allowable under SEC wash sale rules), one could swap more often than that, one just cannot swap the same security in 31 days.

How To Build A ‘Lifetime’ Portfolio (Step 1)

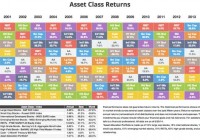
Why obsess about what will happen this coming week? That’s the job of people who get paid by the word. Why not take the road less traveled and ignore 90% of the hullabaloo?!! This is the time of year when most investment writers predict what will happen in 2015. What I’d rather offer, however, is what is “most” likely to happen this year, next year, or the next 10, 20 or 50 years. The short and glib answer is the one proffered by J.P. Morgan when asked what the market would do next. “It will fluctuate,” he replied. That may sound offhandedly dismissive of the question, but in fact there is much truth, and the beginnings of what we now call Modern Portfolio Theory (MPT) in his pithy response! Modern Portfolio has much to recommend it and much to eschew. The basic idea is solid: MPT is a way to optimize your returns based on your acceptable level of market risk. You accomplish this by diversification among various asset classes. If you can remember as far back as January 2014, almost every pundit was predicting a disastrous year for bonds, a so-so year for US stocks to digest the gains of 2013, and sector bets all over the place. I don’t know of a single analyst who predicted that the best-performing sector in the USA would be utilities, yet there they are, proudly atop all markets. The matrix below shows what asset class performed best over the past few years. (These are asset classes, not business sectors, so you won’t see utilities there, but you will see “REITs” and both “High Grade” and “High Yield” bonds, both of which are equally-interest-rate-sensitive.) If you look carefully at every year, you will note the results vary considerably. The same holds true over all other, even more extended, periods. Diversification works! Yes, you will sometimes fail to beat the market, “market” being shorthand to most investors for the “Large Caps” represented by the S&P 500, but over most periods other than an out-and-out bull romp in US stocks that means you are likely to do much better. (click to enlarge) You’ll note, for instance, that in 2000, the large caps, as measured by the S&P 500, were the 3rd- worst performing asset class. In 2002, they were “dead last.” In fact, if you look closely, you’ll note that not once was the S&P 500 the top-performing asset class – including the past 6 remarkable years! Being open to other asset classes is the heart of Modern portfolio Theory, but also the heart of Asset Allocation theory, and the heart and soul of our approach to building a Lifetime Portfolio. In a period of low and declining or stable interest rates, the aforementioned utilities, bonds and REITs often outperform stocks, and with considerably less volatility and heartburn. MPT has also become associated with the notion that, since no one can predict what will happen on any given market day (or week, month, year, etc.) why bother? Why not instead select the asset classes that give you a level of risk you are comfortable with and then get reasonable returns year in and year out? Rigorous academic research shows that you will typically come out ahead after even a few years of doing this than you will if you try to “beat the market.” To oversimplify: if your risk tolerance is low, you might create a portfolio of 40% high grade bonds, 20% REITs, 20% high yield bonds and 20% large cap stocks. If you are comfortable seeking greater returns with greater risk, you might select 10% each of high grade and high yield bonds and REITs, with the other 70% of your portfolio split among US Large and Small Caps, International Large and Small Caps, and Emerging Markets. In any scenario you construct, you want to let your profits grow while feeding the areas you have selected that aren’t doing as well. The usual way this is done is to rebalance at some defined period every year (or less). A variation of this is to pick a certain percentage, say 20%, and if one asset class gets “out of whack” by that amount you add to it if it is down, or sell off some of it if it exceeds the 20% higher than your chosen percentage allocation. If you wanted to hold 20% of your portfolio in large caps, for instance, if that asset class appreciates 20% and is now therefore 24% of your total portfolio (20% of 20 is 4), you would “re-balance” to bring that part of the portfolio back to your risk comfort level, using the proceeds to buy, at lower cost, some of the other asset classes that are “currently” lagging. Does this sound boring? It may be, but which sounds better: a 7.4% annual return over 14 years or a 4.3% return? The bottom line on the above chart is that the simplest asset allocation plan imaginable, 40% high grade bonds, 15% each U.S. large caps and international stocks, and 10% each of small caps, emerging markets and REITs, rebalanced annually, still beat the currently-in-vogue “just buy an S&P 500 index fund; active management doesn’t work” mantra. This “just buy an S&P 500 index fund; active management doesn’t work” fable becomes popular once we are well ensconced in a bull market – and dies just as quickly when the market plummets. As the data above shows, the drawdown for the S&P 500 was -37% in 2008. The biggest drawdown for the asset allocation model (AA) was -22.4%. For comparison, our Growth and Value portfolio, in which we used our own variations on asset allocation described below, was down 18.7% that year. On a million dollar portfolio, the S&P would have declined in value to $670,000; our G&V to $813,000, with less position risk and less volatility. How We Diverge From the Standard Model There are scores of ways you might select an asset allocation model that works for you, from changing the percentage allocations to increasing the asset classes to adding a little sentiment, fundamental, historic or technical analysis. We try not to sway too far from the basic principles of asset allocation. We like to think we are merely adding a dollop of common sense and placing history on our side. We believe: Rebalancing based on the calendar is folly. In the chart above, the results tabulated are for a rebalance once a year at the beginning of each year. Macro-trends evidence themselves any time of the year; both black and white swans swoop and dive based upon events, not calendars. We take action when our asset allocation percentages diverge from our intended allocation. Underlying the concept of asset class investing is the assumption that markets are efficient and that investors act rationally. We might give some credence to the first assumption, but the second is patently false! We believe we can benefit from investor emotions. An example today might be early nibbling at the huge integrated oil companies that can slash CapEx and make a profit on their current properties if the price of oil falls even another 50%. Buy them when they’re cheap; don’t obsess if something you buy for 10 times forward earnings and a 5.9% yield falls so that you “might have” bought it at 8 times forward earnings and a 6.4% yield. At times when interest rates are rising, we might be as little as 0-20% in bonds and REITs combined. When falling, we might be at 60-70%. We are dynamic, not static. [This is a very big divergence from the academics’ idea of asset allocation. That’s their way; this is our way.] “To every thing there is a season.” We augment our asset class investing to take advantage of the fact that small caps tend to enjoy the bulk of their outperformance in the first two quarters of the year, that pre-presidential election years are often excellent market years as both parties crank up the PR machines, etc. We don’t chase any single asset class like S&P 500 large caps, REITs, small caps or any other. Nor do we obsess if we fall behind in comparison to any one asset class for an extended period. We maintain our discipline and do our best to grow our portfolios steadily. Sometimes we have setbacks, sometimes we are out of sync, but we’ve always bounced back. In Part II, I will discuss the asset classes that are historically most and least correlated with the S&P 500 (U.S. large caps) and with each other, so you can begin to consider how you might construct a Lifetime Portfolio that works for you. I’ll also discuss the types of mutual funds and ETFs our research and analysis leads us to, including examples and some of our specific current holdings. As Registered Investment Advisors, we believe it is our responsibility to advise that we do not know your personal financial situation, so the information contained in this communiqué represents the opinions of the staff of Stanford Wealth Management, and should not be construed as personalized investment advice. Past performance is no guarantee of future results, rather an obvious statement but clearly too often unheeded judging by the number of investors who buy the current #1 mutual fund one year only to watch it plummet the following year. We encourage you to do your own due diligence on issues we discuss to see if they might be of value in your own investing. We take our responsibility to offer intelligent commentary seriously, but it should not be assumed that investing in any securities we are investing in will always be profitable. We do our best to get it right, and we “eat our own cooking,” but we could be wrong, hence our full disclosure as to whether we own or are buying the investments we write about.
MDYG Looks Like A Great ETF, I Don’t See A Single Weakness

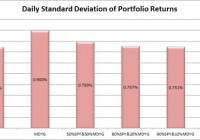
Summary I’m taking a look at MDYG as a candidate for inclusion in my ETF portfolio. MDYG offers investors enough liquidity to reduce risks of being stuck in an undesired position. The liquidity, in my opinion, is better than it appears from trading volume. The correlation is respectable and based off a strong enough level of liquidity that I have some confidence in the statistics. From the diversification to the expense ratio, I can’t find a single problem. I don’t intend to focus on “growth” companies, but I might make a small niche for MDYG. I’m not assessing any tax impacts. Investors should check their own situation for tax exposure. How to read this article : If you’re new to my ETF articles, just keep reading. If you have read this intro to my ETF articles before, skip down to the line of asterisks. This section introduces my methodology. By describing my method initially, investors can rapidly process each ETF analysis to gather the most relevant information in a matter of minutes. My goal is to provide investors with immediate access to the data that I feel is most useful in making an investment decision. Some of the information I provide is readily available elsewhere, and some requires running significant analysis that, to my knowledge, is not available for free anywhere else on the internet. My conclusions are also not available anywhere else. What I believe investors should know My analysis relies heavily on Modern Portfolio Theory. Therefore, I will be focused on the statistical implications of including a fund in a portfolio. Since the potential combinations within a portfolio are practically infinite, I begin by eliminating ETFs that appear to be weak relative to the other options. It would be ideal to be able to run simulations across literally billions of combinations, but it is completely impractical. To find ETFs that are worth further consideration I start with statistical analysis. Rather than put readers to sleep, I’ll present the data in charts that only take seconds to process. I include an ANOVA table for readers that want the deeper statistical analysis, but readers that are not able to read the ANOVA table will still be able to understand my entire analysis. I believe there are two methods for investing. Either you should know more than the other people performing analysis so you can make better decisions, or use extensive diversification and math to outperform most investors. Under CAPM (Capital Asset Pricing Model), it is assumed every investor would hold the same optimal portfolio and combine it with the risk free asset to reach their preferred spot on the risk and return curve. Do you know anyone that is holding the exact same portfolio you are? I don’t know of anyone else with exactly my exposure, though I do believe there are some investors that are holding nothing but SPY. In general, I believe most investors hold a portfolio that has dramatically more risk than required to reach their expected (under economics, disregarding their personal expectations) level of returns. In my opinion, every rational investor should be seeking the optimal combination of risk and reward. For any given level of expected reward, there is no economically justifiable reason to take on more risk than is required. However, risk and return can be difficult to explain. Defining “Risk” I believe the best ways to define risk come from statistics. I want to know the standard deviation of the returns on a portfolio. Those returns could be measured daily, weekly, monthly, or annually. Due to limited sample sizes because some of the ETFs are relatively new, I usually begin by using the daily standard deviation. If the ETF performs well enough to stay on my list, the next levels of analysis will become more complex. Ultimately, we probably shouldn’t be concerned about volatility in our portfolio value if the value always bounced back the following day. However, I believe that the vast majority of the time the movement today tells us nothing about the movement tomorrow. While returns don’t dictate future returns, volatility over the previous couple years is a good indicator of volatility in the future unless there is a fundamental change in the market. Defining “Returns” I see return as the increase over time in the value known as “dividend adjusted close”. This value is provided by Yahoo. I won’t focus much on historical returns because I think they are largely useless. I care about the volatility of the returns, but not the actual returns. Predicting returns for a future period by looking at the previous period is akin to placing a poker bet based on the cards you held in the previous round. Defining “Risk Adjusted Returns” Based on my definitions of risk and return, my goal is to maximize returns relative to the amount of risk I experienced. It is easiest to explain with an example: Assume the risk free rate is 2%. Assume SPY is the default portfolio. Then the risk level on SPY is equal to one “unit” of risk. If SPY returns 6%, then the return was 4% for one unit of risk. If a portfolio has 50% of the risk level on SPY and returns 4%, then the portfolios generated 2% in returns for half of one unit of risk. Those two portfolios would be equal in providing risk adjusted returns. Most investors are fueled by greed and focused very heavily on generating returns without sufficient respect for the level of risk. I don’t want to compete directly in that game, so I focus on reducing the risk. If I can eliminate a substantial portion of the risk, then my returns on a risk adjusted basis should be substantially better. Belief about yields I believe a portfolio with a stronger yield is superior to one with a weaker yield if the expected total return and risk is the same. I like strong yields on portfolios because it protects investors from human error. One of the greatest risks to an otherwise intelligent investor is being caught up in the mood of the market and selling low or buying high. When an investor has to manually manage their portfolio, they are putting themselves in the dangerous situation of responding to sensationalistic stories. I believe this is especially true for retiring investors that need money to live on. By having a strong yield on the portfolio it is possible for investors to live off the income as needed without selling any security. This makes it much easier to stick to an intelligently designed plan rather than allowing emotions to dictate poor choices. In the recent crash, investors that sold at the bottom suffered dramatic losses and missed out on substantial gains. Investors that were simply taking the yield on their portfolio were just fine. Investors with automatic rebalancing and an intelligent asset allocation plan were in place to make some attractive gains. Personal situation I have a few retirement accounts already, but I decided to open a new solo 401K so I could put more of my earnings into tax advantaged accounts. After some research, I selected Charles Schwab as my brokerage on the recommendation of another analyst. Under the Schwab plan “ETF OneSource” I am able to trade qualifying ETFs with no commissions. I want to rebalance my portfolio frequently, so I have a strong preference for ETFs that qualify for this plan. Schwab is not providing me with any compensation in any manner for my articles. I have absolutely no other relationship with the brokerage firm. Because this is a new retirement account, I will probably begin with a balance between $9,000 and $11,000. I intend to invest very heavily in ETFs. My other accounts are with different brokerages and invested in different funds. Views on expense ratios Some analysts are heavily opposed to focusing on expense ratios. I don’t think investors should make decisions simply on the expense ratio, but the economic research I have covered supports the premise that overall higher expense ratios within a given category do not result in higher returns and may correlate to lower returns. The required level of statistical proof is fairly significant to determine if the higher ratios are actually causing lower returns. I believe the underlying assets, and thus Net Asset Value, should drive the price of the ETF. However, attempting to predict the price movements of every stock within an ETF would be a very difficult and time consuming job. By the time we want to compare several ETFs, one full time analyst would be unable to adequately cover every company. On the other hand, the expense ratio is the only thing I believe investors can truly be certain of prior to buying the ETF. Taxes I am not a CPA or CFP. I will not be assessing tax impacts. Investors needing help with tax considerations should consult a qualified professional that can assist them with their individual situation. The rest of this article By disclosing my views and process at the top of the article, I will be able to rapidly present data, analysis, and my opinion without having to explain the rationale behind how I reached each decision. The rest of the report begins below: ******** (NYSEARCA: MDYG ): SPDR® S&P 400 Mid Cap Growth ETF Tracking Index: S&P MidCap 400 Growth Index Allocation of Assets: At least 80% to securities in the index Morningstar® Category: Mid-Cap growth Time period starts: April 2012 Time period ends: December 2014 Portfolio Std. Deviation Chart: (click to enlarge) (click to enlarge) Correlation: 85.22% Returns over the sample period: (click to enlarge) Liquidity (Average shares/day over last 10): About 17,000 Days with no change in dividend adjusted close: 10 Days with no change in dividend adjusted close for SPY: 5 Yield: .88% Distribution Yield Expense Ratio: .25% Discount or Premium to NAV: .16% premium Holdings: (click to enlarge) Further Consideration: Definitely Conclusion: MDYG comes out of this looking fairly reasonable. It isn’t my goal to put a growth weighting into my portfolio, but the correlation is respectable, the liquidity is solid, and the expense ratio is reasonable. While liquidity of 17,000 isn’t huge, the dividend adjusted close was regularly changing. Out of the 10 days in which the dividend adjusted close did not change, there were 5 in which the trading volume was actually 0 for the day. In my opinion, that’s enough liquidity to be worthy of consideration. The yield isn’t very high, but I can deal with that. If I wanted to orient my portfolio towards growth rather than value I think MDYG would be a very strong contender. Due to the orientation I want, if I use MDYG it will be a fairly small position and I will have to compare it directly with a few other ETFs that focus on growth. For my investing style, the ideal exposure is probably around 5%. The best thing for the ETF is probably the complete lack of red flags that I’ve seen. There is no single factor that I can point out as a problem. In my opinion, any ETF that comes out of this with 0 intrinsic weaknesses deserves some consideration. Additional disclosure: Information in this article represents the opinion of the analyst. All statements are represented as opinions, rather than facts, and should not be construed as advice to buy or sell a security. Ratings of “outperform” and “underperform” reflect the analyst’s estimation of a divergence between the market value for a security and the price that would be appropriate given the potential for risks and returns relative to other securities. The analyst does not know your particular objectives for returns or constraints upon investing. All investors are encouraged to do their own research before making any investment decision. Information is regularly obtained from Yahoo Finance, Google Finance, and SEC Database. If Yahoo, Google, or the SEC database contained faulty or old information it could be incorporated into my analysis. The analyst holds a diversified portfolio including mutual funds or index funds which may include a small long exposure to the stock.