Tag Archives: function

The Permanent Portfolio Fund Looks Weak Long-Term
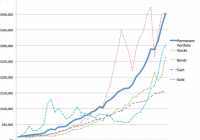
Summary Harry Browne’s simple concept of the permanent portfolio is still valid and is a low volatility method of passive investing. PRPFX does not closely follow the original concept of the PP and the current allocation is closer to stock picking than passive investing. PRPFX has become too volatile to be considered as a safe, long-term investment. Constructing your own PP with ETFs is cheaper than the mutual fund fees and allows you to stick with the original concept. While the concept is still valid today, it needs to be modernized in terms of internationalizing the asset classes and not putting all of the PP into one country. The Permanent Portfolio Concept In the early 80s, the idea of the permanent portfolio was created by Harry Browne and Terry Coxon and was laid out in a series of books written by the two. The whole concept is based upon the idea that nobody knows exactly what will happen in the future, and your investments should reflect this fact. The permanent portfolio calls for splitting the assets equally into 4 parts: 25% stocks, 25% bonds, 25% cash, and 25% gold. The portfolio would be rebalanced once a year, or if any one asset rises too much during the year. The purpose of this allocation is to have at least one portion of your portfolio doing well, regardless of the economic environment at the time. Harry Browne referred to 4 different general economic scenarios that the portfolio would address: inflation, deflation, prosperity, and depression/recession. The world around us is not quite that simple however, and today we see a hodgepodge of these 4 scenarios. There is deflation in things like oil, gold, silver, and smartphone technology, at the same time as inflation in medical care, college tuition, and certain food items. You cannot label today’s economy with only one term such as inflationary or deflationary. As Jim Rickards says , inflation and deflation are now locked into a very equally matched game of tug-of-war, since high amounts of force and tension on both sides will result in the rope being tugged nowhere despite all of the forces at play. Because of this, the permanent portfolio concept is even more relevant today than in the past. The 25% allocation to gold is enough to give most financial advisors the shivers, but when you look at the results of the PP compared to each of its components individually, it makes a lot more sense. (click to enlarge) Basically you end up with conservative gains and a lot less volatility overall. I would compare the PP strategy to riding a bicycle with training wheels on a flat path while wearing a helmet, elbow pads, and knee pads. You could certainly still crash, but you won’t be as scraped and banged-up as if you had gone all in with the stock market, for example, and it won’t be too terribly difficult to pick yourself up and be headed back down the path. So with this in mind, let’s look at the mutual fund that was based on Browne’s concepts and the flaws that it currently has. Permanent Portfolio Fund – PRPFX This is the flagship fund from the Permanent Portfolio Family of Funds. The fund was founded in 1982 by Terry Coxon and John Chandler. The allocation is quite a bit different than the original PP concept. It is only loosely based around the 25% x 4 allocation, as it has 6 asset classes made up of 36% US dollar assets, 20% gold, 15% aggressive growth stocks, 15% real estate and natural resource stocks, and 10% Swiss franc assets and 5% silver. The biggest problem with this allocation is the great over-emphasis on commodities. The purpose of having 1/4 gold in the PP concept is to act as something that will go up in periods of severe inflation and/or economic turmoil. Adding natural resource stocks and physical silver just adds more volatility that isn’t even necessary. Extra volatility is exactly what you don’t want for a long-term, wealth compounding fund. Take a look at the level of volatility since 2011. (click to enlarge) Does this look like a steady, conservative fund that you can dollar-cost average into every month and compound your wealth with? No investor should accept this level of volatility on something that is supposed to be safe and conservative. But let’s not get too caught up in the short-term price, let’s look at how PRPFX did since 2000 compared to the Dow and the S&P 500. (click to enlarge) As you can see, PRPFX beat the two indexes over the long run, so if you bought this fund in the year 2000 then you deserve a pat on the back. However, if you are looking to start a position or continue an existing position in this fund, you are in for a bumpy ride. Instead of safely biking down a straight path with training wheels and pads on, you will be wearing no safety equipment and speeding further across a very hilly/curvy terrain. The distinction always needs to be made between investing and speculating when it comes any particular security, and in the case of PRPFX the inherent problem with the allocation is that commodities and particularly natural resource stocks are speculative in nature. So mixing these things in with bonds and bank deposits creates a problem. Take some of the mining stocks the fund holds for example, BHP , Vale S.A. (NYSE: VALE ) and Peabody Energy (NYSE: BTU ). BHP is the biggest mining company in the world, but even this fact does not stop it from being volatile and thus speculative in nature. It does not belong in a portfolio of money that you can’t afford to lose. In the cases of Vale S.A. and Peabody, the first company went down 40% over the year 2014 and the second went down 62%. (click to enlarge) Again, these are not the kind of companies you want to have in a portfolio that you expect to draw from in retirement or further down the road. The heavy weighting towards commodities does the fund well when the commodities themselves are in the midst of a bull market, but when the commodities are in a long period of decline it’s very detrimental to the long term investing approach. If you want to implement the original concept, you can do so using ETFs that will result in lower expense ratios compared to the expense ratio of .75% for PRPFX. Below is an example of a cheaper method of using the original 4 x 4 concept with ETFs: 25% Vanguard S&P 500 ETF- VOO -Expense ratio .05% 25% Vanguard Long-Term Bonds ETF- BLV -Expense ratio .10% 25% Vanguard Short-Term Bonds ETF- BSV -Expense ratio .10% 25% iShares Gold Trust ETF- IAU -Expense ratio .25% Or simply keep this component in physical gold held directly. Even with low expense ETFs, there is still a problem with this allocation. The problem is that all 4 areas are U.S. based which means you are putting all of your eggs into the American basket. Most people would see no problem with that today, since America is where the action is at. But the point of diversifying is to spread your risk out by not having it all in one place. Never forget the untimely proclamation made by Yale economist Irving Fisher, “Stock prices have reached what looks like a permanent high plateau… I expect to see the stock market a good deal higher than it is today within a few months.” This statement was made on October 19th, 1929, which was a mere 10 days before the infamous Black Friday. Just because things look promising today doesn’t mean that they will stay that way tomorrow. A lot can happen in a short time, and if a crash happens you wouldn’t want all of your portfolio exposed to the country where the crash takes place. The ETF choices for foreign diversification are not as vast as they are for domestic ETFs, but even with limited choices it could be easier than owning something like international bonds directly. Below is an example of such a portfolio: 25% iShares MSCI China ETF- MCHI 25% WisdomTree Asia Local Debt ETF- ALD 25% Australian Dollar Trust ETF- FAX 25% iShares Gold Trust ETF-IAU or physical gold You don’t want to just randomly pick a mix of countries, obviously Greek bonds and Russian rubles are not smart choices right now. Go for countries that have the least amount of economic/political chaos and that have decent reputations for economic freedom. Also, don’t spend the time back testing different ETFs in order to find the optimal allocation for the future. This defeats the whole purpose of admitting that you don’t know exactly how the future will play out. If you are ready to admit this, then the PP concept might be just for you.

Arctic Cold Brought Up UNG – For A Short Time

Summary Colder-than-normal weather brought up the price of UNG. EIA still estimates this year’s natural gas price to remain lower than last year’s. This week’s extraction from storage is estimated to be higher than the 5-year average. The recent news of possible Arctic weather in the coming week pushed up back up the price of United States Natural Gas (NYSEARCA: UNG ) to pass $16 at one point. Since then, however, its price resumed its descent. The price of UNG ended last week at $15.69 – representing a 4.6% gain, week over week. Despite the recent rally in UNG, it’s still 16% down in the past month. The cold snap drove up the U.S. consumption by nearly 7%, week over week. Most of this gain was in the residential/commercial sectors. Despite the low prices of natural gas, the U.S. natural gas output is still up by roughly 10% for the year. If prices were to remain low, however, this could eventually curb down the growth rate in the natural gas output in the coming quarters. But the main issue revolves around the potential changes in the demand for natural gas mainly in the residential/commercial sectors. Over the next couple of weeks, the temperatures mainly in the Northeast and Midwest are projected to be lower than normal. In the west coast temperatures are expected to be higher than normal. Conversely, this week, the current outlook for the heating degrees days shows lower than normal levels. Nonetheless, it seems that the low temperatures are likely to keep driving up the demand for natural gas for heating purposes. Let’s turn to the latest from the natural gas storage. Last week’s Energy Information Administration update showed a 236 Bcf extraction from storage – this was 46 Bcf higher than the 5-year average. But it was also 51 Bcf below last year’s extraction. Source: EIA This week’s extraction from storage is likely to be, again, higher than the 5-year average. Keep in mind, last week’s deviation from normal temperatures was, on average, -4.29. The lower-than-normal temperatures may result in higher than normal withdrawal. Even though the changes in storage provide an indication for the changes in the demand and supply for natural gas on a weekly scale, as I pointed out in the past, the relation between the prices changes in UNG and shifts in storage tend to have a low correlation. This is mostly on a week-to-week examination. On broader scale, however, lower extractions from storage tend to keep UNG down and vice versa. Looking forward, if the extractions from storage were to remain roughly 10% lower than the 5-year average, this could bring the natural gas storage in line with the 5-year average by the time the injection season commences. This is shown in the chart below. Source: EIA The EIA also estimates that the natural gas inventories will be roughly in line with the 5-year average by the end of March 2015. On a yearly scale, the EIA still expects natural gas prices to remain low in 2015 – the annual average price is estimated at $3.44; this is roughly 22% lower than the average yearly price in 2014. The uncertainty in the weather forecasts in the next couple of weeks could lead to big swings in the price of UNG – as was the case in recent weeks. Nonetheless, if temperatures don’t fall below current estimates, this could result in UNG resuming its descent. For more see: Has the Weakness in Oil Fueled the Decline of UNG?

Investing Lessons And Portfolio Update

Never go “all-in”, no matter how tempting it may be. Many forex traders got wiped out by using too much leverage trading the Swiss franc last week. “Protect the downside” and “regular re-balancing” have kept my portfolio from big drawdowns and losses. We have added multiple equity positions and precious metal positions to our 1% income portfolio. First thing, let’s go through what happened with the Swiss franc last Friday. The currency’s value had been pegged to the euro since 2011. The pegged price was “1.2:1”, which meant 1.2 Swiss francs bought you 1 euro. Last Friday, the Swiss National Bank announced that it was going to break the peg and allow its currency to trade freely. The franc rallied strongly on the news, and at one point last Friday, the franc was worth 0.85 euro cents, before finishing at practically parity with the euro. The Swiss stock markets fell sharply, but when you factored in the added strength of the franc, the losses in real terms were much less than reported. So why did the Swiss bank announce such a measure? Well, I believe there could be 2 answers. Firstly, the franc has lost a lot of purchasing power since the middle of last year, as the dollar has made massive gains against the euro. Also, secondly, is the Swiss central bank sniffing our quantitative easing in the near future by the European central bank? If QE gets the go-ahead in Europe, then all currencies that are pegged to the euro will also have to undergo devaluation. However, the Swiss franc is seen as a safe haven internationally, so it would have definitely lost its prestige if the currency continued its devaluation against other currencies such as the dollar. The Swiss economy may hurt for a while, but the right decision was made, in my opinion. The purchasing power of the franc has been prioritised, and this is excellent news for its citizens. So what’s the lesson to be learned here? Well, many currency traders got their portfolios wiped out because of last Friday’s action. An investor or trader can never go “all-in”, no matter how tempting the investment or trade may be. I spoke about this in one of my previous articles . Greed can destroy a portfolio overnight, if it is allowed to. The dollar has been rallying strongly since the middle of last year. Moreover, many currency traders thought that the impending QE in Europe would strengthen the dollar even more against the euro and the Swiss franc. Some shorted the Swiss franc en masse in the hope of making a killing. Unfortunately, all that was “killed” was their portfolios. Re-balancing your portfolio is one of the best techniques out there for controlling greed and keeping your portfolio fresh. If you are holding US stocks, the US dollar or US bonds in your portfolio, I would recommend that you rebalance your portfolio. These 3 sectors have risen a lot in the last 12-18 months. Smart investors would take some money off the table in these sectors and deploy extra capital in more depressed sectors. I am not advocating withdrawing all your capital from these sectors, as there may be many more months of upside, but now may be the time to lighten up instead of doubling down. We are living in volatile times, where any move by a country or central bank could have devastating effects on your portfolio if it is not set up correctly. I say all of the above because the sentiment on the US dollar at the moment is extremely bullish. Everyone expects the dollar rally to continue (and it may very well continue) as Europe tries to get a grip on deflation. Nevertheless, surprises can happen in any market, as we witnessed last week. Could China, for example, break its currency’s peg against the US dollar? Many would say this is highly improbable, as China owns huge amounts of dollar reserves. What if the US announced QE4 in the coming months? Would the Chinese let their currency weaken alongside the dollar? These scenarios may never happen, but position sizing and diversification in your portfolio would protect you from all possible outcomes. Another valuable lesson in investing which ties in well with my last point is “protecting the downside”. Professional investors are far more concerned with the downside (risk) than the upside. Losing money is not an option for them. So let’s look at what an investor can do when he or she is sitting on some nice profits. Let’s take a look at the SPDR S&P 500 Trust ETF (NYSEARCA: SPY ), for example. This ETF has gained 80% over the last 5 years, which is a fantastic return for an ETF. How do we protect the downside? (click to enlarge) 1. We take some money off the table and deploy it into a depressed sector, such as the gold mining sector. 2. We buy a put option (like insurance). If the ETF drops, our put option will go up in value. The net result is that we will lose less if the market falls sharply. If the market continues to rise, we will only lose what we paid for the put option. 3. We place a stop loss under the present price of the ETF (the 200-day moving average is used often by professionals). The problem with a stop loss is that it is less effective when there is volatility in the market (violent swings both ways). Protecting the downside and rebalancing my portfolio every once in a while has not only protected my portfolio, but also has grown it. Finally, we added many positions to our 1% portfolio last Thursday and Friday (see screenshot below). We now have in the region of $130k invested in stocks, but will not be investing more into this asset class for the moment, as we feel other asset classes can give us higher returns going forward (rebalancing). We will fill up our Precious Metals & Commodities asset classes with the full $180k each soon enough, as we have unearthed depressed companies in these sectors and low-cost indexes. Stay tuned. (click to enlarge) Editor’s Note: This article covers one or more stocks trading at less than $1 per share and/or with less than a $100 million market cap. Please be aware of the risks associated with these stocks.