Tag Archives: function

Let’s Talk About Corporate Fraud

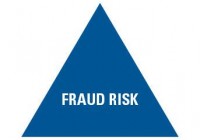
Summary A study predicts that 14.5% of firms, or one in seven, has insiders engaging in fraudulent behavior. They estimated a median loss of 20.4% of the enterprise value. The math of loss works harshly against investors. Rule #1 is to never lose money; Rule #2 is to refer back to Rule #1. We are all here “Seeking Alpha”, but we also want to avoid mistakes and catastrophe. One of the worst ways to lose money is due to corporate fraud. Some companies die a slow death, which you can argue is somewhat predictable, but what about getting Enron-ed? Isn’t that one of your worst fears as an investor that your stock goes to $0 overnight? When reading Intelligent Investor , one of the main concepts that jumped out to me was that numbers are highly subjective! How are you going to count depreciation, how are revenues going to be recognized, what goes off balance sheet… It depends; do you want earnings to be $900 million, $1.1 billion, or $1.3 billion? There are legal ways of playing the accounting game and illegal ways. One dangerous situation is when the executive team has compensation and bonuses tied to earnings which can be very subjective. Earnings can legally be recorded as $900 million, $1.1 billion or $1.3 billion, but if earnings come in at $1.2 billion or higher, then our CEO and the executive team get a big, fat bonus. Given the three choices, guess which earnings the company will have? That’s totally legal, but let’s take it a step further. What if the board members postulate that earnings of $1.5 billion earns our CEO a bonus? Think some creative accounting teams will take the board’s challenge and make it happen? My argument is that corporate fraud is real and that with the market hitting all-time highs – one or more big corporations are destined to go down. The market is “high”, and when the tide comes down, we will see who was swimming naked. The incentives to cheat are enhanced now, and I’d argue that it’s logical to presume that more fraud is occurring. I also seem to remember a fast-talking President make promises about cleaning up Wall Street, yet I missed the follow through part about anybody actually going to jail. Data It is very difficult to determine how rampant fraud is. How do you even quantify it? The data is not easy to find. I read an interesting study, How Pervasive is Corporate Fraud? by Dyck, Morse, and Zingales. Here are some key takeaways from their excellent study: – Over their time period studied, 4% of large publicly traded firms were eventually revealed to be engaged in fraud. They estimate that only 27.5% of fraud is detected, leading to an estimate that 14.5% of firms, or one in seven, has insiders engaging in fraudulent behavior. – They estimated a median loss of 20.4% of the enterprise value of the fraud companies was lost – measured by the firms’ enterprise value before the fraud took place as a benchmark. This puts a 3% price tag on all the value of all large corporations. – Their study found that on average 14.8% of MBA students were asked to do something illegal in their previous employment. Surprisingly, the incidence of illegal behavior did NOT vary among different industries. The only exception was a lower incidence among consumer goods, only 7% or 1/2 the fraud levels. Contrary to expectations, the financial services industry did NOT experience higher levels of illegal activity. A Forbes article echoed similar findings. “The 347 companies that were prosecuted in the decade that ended in 2007 represent a small fraction of the fraud cases that occurred.” Very few fraud cases resulted in SEC enforcement action; a lot of times the fraud resulted in shareholder disappointment, price drops, bond defaults and insolvency. Here is a top 10 list of the worst corporate accounting fraud. So why do it? The Forbes article cited the most common reasons for fraud being: – Desire to meet earnings expectations. – Hide the company’s deteriorating financial condition. – Bolster performance for pending equity or debt financing. – Increase management compensation. Clues – Frequent amendments to financial filings. – Boards chaired by the CEO. – Discrepancy between annual pay and bonus pay for CEO/CFO. – Large insider selling by top executives. – Frequent legal and regulatory issues. – Frequent turnover for officers. Among firms involved in fraud, 26% changed auditors, between the filing of their final clean financial statement and their final fraudulent financial statement. Sixty percent of the firms involved in fraud that changed auditors did so while the fraud was taking place, the other 40% changed auditors right before the fraud began. Conclusion The math of loss really works against you, the investor. If your company’s stock goes down 50% due to fraud or really any other reason, then you need a 100% return to get back to even. You could do all the due diligence in the world and still get wiped out. If auditors, regulators, insiders, board members and key employees can get duped, then so can John Q. Public the retail investor that doesn’t have access to the same information. There are certain industries that I don’t want to invest in due to their sheer complexity – financials. I like being in control, and corporate fraud takes an element of control away from you. In a ZIRP world, with top-line revenues hurting, companies cut costs down to the bone, what’s fueling earnings, buybacks? Nobody was punished during the last go around for fraudulent behavior. Big companies will go down. If anything, corporate fraud just increases the argument for diversification and never buying company stock in your 401(k) because you can never be sure. Disclosure: The author has no positions in any stocks mentioned, and no plans to initiate any positions within the next 72 hours. (More…) The author wrote this article themselves, and it expresses their own opinions. The author is not receiving compensation for it (other than from Seeking Alpha). The author has no business relationship with any company whose stock is mentioned in this article.

VNQ: Take The 3.85% Yield; Duplication Is Rarely Worth It

Summary I’ve been getting questions about why investors should choose VNQ over buying largest holdings within VNQ. VNQ offers substantially better diversification than investors can create by replicating the top holdings. The ETF yield is surprisingly similar to the yields across the top holdings. If an investor is committed to a plan of dollar cost averaging, VNQ offers a smart way to minimize trading costs. Vanguard REIT Index ETF (NYSEARCA: VNQ ) offers investors strong distribution yields at a rate of 3.89%. However, some investors are contemplating if they would be better off simply buying the top 5 or 10 holdings of VNQ to avoid the expense ratio and generate more income by concentrating their investments in the REITs with the highest yields. It’s a reasonable idea and it is worth some discussion. I wanted to offer a thorough response on some of the reasons that I believe investing in VNQ is superior to trying to replicate the portfolio through buying the top ten holdings. Holdings I put together a quick chart showing the recent holdings of VNQ based on their most recent market values. (click to enlarge) The top 10 holdings make up about 37% to 38% of the value of the ETF. That is a fairly substantial portion, but not substantial enough that it would make it easy to duplicate the fund by buying the top holdings. An investor that only buys the top 10 would still be missing out on a very substantial amount of diversification from the other 62% or so of the portfolio. Dividend Yields I put together a chart showing the dividend yields on each of the top 10 positions. For the convenience of readers, I kept the holdings in the same order rather than sort them by the highest dividend yields: (click to enlarge) There are certainly a few REITs in this ETF that are paying much higher yields than the main portfolio, but investors focusing on only the highest yield REITs will be putting themselves at risk for slower growth in the pay outs or more risk to the dividend itself. Higher yields are often related to higher levels of risk, so holding only the highest yielding REITs would result in a significantly higher concentration of risk. If you were to take the average yield (equally weighted) of the top 5 REITs, you would have 4.018%. If you take the average yield across the top 10, it is 3.764%. This suggests that all around VNQ is paying a fairly similar level of dividends to what an investor would expect if they focused on buying the top 5 or top 10 holdings by market value in an equally weighted portfolio. Expense ratios are fairly low The Vanguard REIT Index ETF has an expense ratio of only .12%. That does cost shareholders money compared to simply holding all of the underlying securities, but the cost is fairly low compared to the benefits. In exchange for the .12% ratio the investors are able to buy shares in a high liquid ETF with the spread is frequently one cent. On a share price that is floating around $77, that is a very attractive bid ask spread. For comparison, at the time of my checking Simon Property Group, Inc. ( SPG) had a 4 cent bid ask spread on a price around $176 (slightly better larger than VNQ), P ublic Storage (P SA) had a spread of 4 cents on a price around $187, Equity Residential ( EQR) had a spread of 1 cent on shares running around $70 (about equal to VNQ), and Health Care REIT, Inc. ( HCN) had a spread of 2 cents on a price slightly under $70. In short, the Bid-Ask spread on even the largest equity REITs is slightly worse than the spread on VNQ. Granted, if you have an indefinite holding time period the spread is only an issue when purchasing, but it does increase the cost of buying into the position. If an investor has free trading on VNQ (some brokerages do), then their trading cost to buy into positions is limited to crossing the spread. If an investor is simply doing a buy and hold with a 40 year time frame, this isn’t a huge consideration. For the investor with a 40 year time frame that is buying their REITs in one single purchase, it makes sense to replicate the fund. For an investor with a long time frame that intends to continue investing REITs by buying into their position every month or every quarter for dollar cost averaging, it would be better to take advantage of the low spreads and look for a brokerage that is offering no commissions on VNQ. Conclusion While it would be possible to generate higher yields than VNQ by picking the equity REITs with the highest yields, it would also leave an investor facing significantly more diversifiable risk. The extra income may be nice and replicating the portfolio through buying a very large volume of the securities (you’d need more than 10) would make sense for a long term investor that does not plan to be investing new money every month or every quarter. For the investor that is planning to dollar cost average into their investments and builds them up over a period of years, the purchases will be more frequent and the investor may save more on trading commissions and spreads than they lose on the expense ratio. Whether this works or not will depend on the individual investor. My dollar cost averaging strategy puts in place a minimum amount of purchasing activity for REITs, but I will occasionally add to the position when I see share prices fall. Disclosure: The author is long VNQ. (More…) The author wrote this article themselves, and it expresses their own opinions. The author is not receiving compensation for it (other than from Seeking Alpha). The author has no business relationship with any company whose stock is mentioned in this article. Additional disclosure: Information in this article represents the opinion of the analyst. All statements are represented as opinions, rather than facts, and should not be construed as advice to buy or sell a security. Ratings of “outperform” and “underperform” reflect the analyst’s estimation of a divergence between the market value for a security and the price that would be appropriate given the potential for risks and returns relative to other securities. The analyst does not know your particular objectives for returns or constraints upon investing. All investors are encouraged to do their own research before making any investment decision. Information is regularly obtained from Yahoo Finance, Google Finance, and SEC Database. If Yahoo, Google, or the SEC database contained faulty or old information it could be incorporated into my analysis.

Sky High Valuations? Lusterless Economy? It Just Doesn’t Matter!

Sky high stock valuations do not matter in an era of worldwide central bank rate manipulation. And yet, there are a few things that may still carry weight with the global investing community as we move forward in 2015. The way that I view it, the appeal of all risk assets in the large-cap universe had shot out of a cannon in the first half of 2013. In 2015, however, the S&P 500 A/D line has flattened out. Several years ago, Rolling Stone ranked the 10 best movies by former cast members of Saturday Night Live. Bill Murray barely made the list with Rushmore – an offbeat comedy from the late 90s. I remember thinking that Murray had been cheated in the editorial; he should have received additional nods for Caddyshack, Stripes, Lost In Translation as well as What About Bob. In that vein, how on earth did they miss the quintessential camper experience from my youth, Meatballs? Granted, Meatballs did not have the critical acclaim of Lost in Translation or the monumental influence of Caddyshack; the writer may not have been alive in the 70s. Nevertheless, Meatballs had one of the most iconic quasi-motivational speeches ever. Murray’s character, head counselor Tripper Harrison, persuades a band of misfit teens to take on the elite athletes from another camp by celebrating nonconformity. Here’s a snippet from the inspirational talk: Murray (Tripper Harrison): Even if every man, woman and child held hands together and prayed for us to win, it just wouldn’t matter, because all the really good looking girls would still go out with the guys from Mohawk ’cause they’ve got all the money! It just doesn’t matter if we win or we lose. Campers and Counselors: IT JUST DOESN’T MATTER! IT JUST DOESN’T MATTER! IT JUST DOESN’T MATTER! Thirty six years since the release of Meatballs, I find my mind drifting back to Bill Murray’s humorous exchange with his dejected campers. (In some ways, he may have been speaking directly to movie-goers.) I address legitimate concerns about risk assets regularly. And yet, sky high stock valuations do not matter in an era of worldwide central bank rate manipulation. I chronicle the good, the bad and the ugly about the economy daily. And still, it just doesn’t matter to the risk-on herd. For example, it has been well-documented that the price-to-book (P/B), price-to-sales (P/S) and P/E) of the median stock on U.S. exchanges have never been higher. Not even during the dot-com craziness in March of 2000. Similarly, U.S. stock market value as a percentage of gross national product is at 150%; that represents the second highest level in U.S. history. Warren Buffett wrote in 2001 that when one buys stocks in the 70%-80% range, the decision is likely to work out well. At present, the “Buffett Indicator” is 2x preferred levels. Does it matter? Not in the immediate term. What about the economy that has been lumbering along at a 2% clip for six-and-a-half years? Those sub-par growth results in the recovery required extraordinary emergency measures of $3.75 trillion in asset purchases by the Federal Reserve System; it also required federal government excess spending of $7.5 trillion. More recently, industrial production – a measure of output for manufacturers, miners and utilities – dropped 0.2% in May and has not increased since November of last year. The Federal Reserve Bank of New York’s Empire State manufacturing survey registered a negative reading (-2.0) in June – its second negative report in the last three months. Does it matter? Not particularly. In contrast, there are a few things that may still carry weight with the global investing community as we move forward in 2015. For instance, the evidence surrounding the potential for a disorderly exit by Greece from the euro suggests that markets may struggle a bit more than most media pundits are willing to acknowledge. More importantly, recent downshifts in market breadth have convinced me that a defensive allocation is warranted. Keep in mind, when investors are gaga for risky assets, they often acquire them across the board. Yet both the NYSE and the S&P 500 have seen a definitive breakdown in the number of advancers compared with the number decliners. The NYSE Advance Decline Line (A/D) has not been this far below its near-term 50-day moving average since the October swoon and the November “Bullard Bounce.” The S&P 500 is also losing some if its participants in the rally. Throughout May and June, less and less of component companies are moving higher in established uptrends. During highs that were established over the last six months, bullish breadth readings clocked in near 75%. Bullishness via the Bullish Percentage Index (BPI) for the S&P 500 is about as weak as it was in February. We can even take a look at the slope of the advance/decline line for the S&P 500. The way that I view it, the appeal of all risk assets in the large-cap universe had shot out of a cannon in the first half of 2013. And while the desire tapered off a bit between the 2nd half of 2013 and the end of 2014, the passion was still there. In 2015, however, the S&P 500 A/D line has flattened out. Granted, the benchmark can still move higher with less and less corporate shares participating; market-cap weighted indexes concentrated in the “Apples” will do that. On the flip side, weakening breadth can also mark a turning point such that stocks will move dramatically higher or dramatically lower. Indeed, we have been approaching a critical crossroads. The Federal Reserve is deciding whether to begin a campaign of tightening borrowing costs slightly or to wait for definitive data that is unlikely to ever confirm genuine economic strength. More importantly, what the Fed actually does will be far less important than the interpretation by the global investing community. The Fed might raise rates 0.125% at a 2015 meeting that is so slow, risk-takers would likely celebrate; the Fed might raise overnight lending rates 0.25% while simultaneously expressing that they won’t do so again until three months of upbeat data. Conversely, the Fed could misread the signals by simply hiking borrowing costs on the belief that the economy is healthy enough to withstand the heat, spiking volatility in treasuries as well as equities. Or, they might sound so downbeat in their assessment, stocks could flounder on recessionary fears. In other words, different things matter at different times. Keep an eye on the iShares 7-10 Year Treasury Bond ETF (NYSEARCA: IEF ). If the price of IEF climbs above and stays above its 200-day moving average, it may suggest that fears of Fed rate hikes were overblown. Stocks would likely benefit from contained borrowing costs. In contrast, if IEF stays below its 200-day and drops significantly below its June low near 104, expect corrective activity for riskier stock assets. Click here for Gary’s latest podcast. Disclosure: Gary Gordon, MS, CFP is the president of Pacific Park Financial, Inc., a Registered Investment Adviser with the SEC. Gary Gordon, Pacific Park Financial, Inc, and/or its clients may hold positions in the ETFs, mutual funds, and/or any investment asset mentioned above. The commentary does not constitute individualized investment advice. The opinions offered herein are not personalized recommendations to buy, sell or hold securities. At times, issuers of exchange-traded products compensate Pacific Park Financial, Inc. or its subsidiaries for advertising at the ETF Expert web site. ETF Expert content is created independently of any advertising relationships.