Tag Archives: function

AES Corporation – A Long-Term Bet

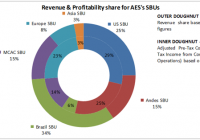
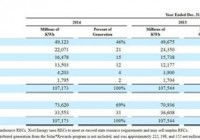
Summary AES is well-diversified Fortune 200 global power company. An early mover in the energy storage business, AES appears to have a good strategic focus. The company’s stock appears to be undervalued relative to its peers. Headquartered in Arlington, Virginia, AES Corporation (NYSE: AES ) is a $17b global power company, which makes it a Fortune 200 company. It owns and operates a diverse portfolio of electricity generation and distribution businesses. I think the company is a good long-term pick because of the following 3 reasons: Global Diversification The company’s electricity generation and distribution operations are spread globally across 18 countries. In terms of power generation capacity, only 12GW out of a total of 36GW is generated by the company in the US. The company’s operations in emerging economies should help the company achieve higher growth rates over the next few years. Its operations in US and Europe should provide relatively lower but stable growth for the company. Such global diversification helps the company mitigate risk. Overall, I would argue that this geographical diversification is a good strategy, though some would argue otherwise citing the foreign exchange risk and the political risk that comes inherent with such strategies. Looking at the last quarter revenues and profitability measure of the company’s different Strategic Business Units (NYSEARCA: SBUS ), two observations stand out – First, while Brazil contributed the highest revenues (34%) amongst all SBUs, its profitability share was only 6%. A major contributing factor to the low profit margins from Brazil was the unfavourable foreign exchange impact. Second, Europe is contributing disproportionately higher profits to the company compared to its revenues. Combined, these individual inconsistencies a part and parcel of the company’s strategy of global diversification. Strong Strategic Focus The company has a reasonably good corporate and business strategy in place. In the last few areas, the company has exited some “non-core” markets and recycled the sell-off proceeds. Since September 2011, the company has exited 10 countries and raised $3b in equity proceeds. In the markets where the company believes it has a competitive advantage, $7 billion worth of projects are in the pipeline. These are expected to be completed in the period from 2015 to 2018. (Source: AES Investor Presentation, May 2015, www.aes.com/investors/presentations-and-… ) AES has been an early mover in the battery-based energy storage business. With distributed energy gaining prominence, this augurs well for the company. Tesla (NASDAQ: TSLA ) was in the news recently for introducing batteries to manage energy needs. However, AES already has batteries operating in big battery farms on the grid (86 MW), some projects under construction (50 MW) and other projects in the late stage of construction (210 MW). AES also recently acquired Main Street Solar, which gives AES the capabilities to enter the distributed solar market, a future growth market. Undervalued Stock AES appears to be undervalued when we look at its P/E ratio and Price-to-sales ratio relative to some of its peers. If we were to base our judgment of the company based on these two ratios alone, AES should have been a strong buy. These two ratios for the company are amongst the lowest in the industry. However, another ratio the Price-to-book (P/B) ratio is amongst the highest in the industry, indicating the company is overvalued. Price-to-book ratio is definitely a good ratio to look at, especially when looking at capital-intensive businesses like AES. The reason for the high P/B ratio is the high levels of debt that the company has. The company had a debt-to-equity ratio of close to 5, which is relatively high, in March 2015. With high debt, its interest coverage ratio at that time was a not-so-healthy 1.83. So, although this would be an area of concern for some, I believe the company has the ability to navigate safely through this. This is based on the fact that these ratios have been in a similar range for AES before and the company has a sound business plan going forward. The company appears to be well-positioned for a decent growth in the next few years, according to the company guidance. The company has estimated the following for the future – the period from 2015 to 2018 – 10-15% annual free cash flow growth – 5% average EPS growth from – 10% annual growth in dividends – 8% average annual total return Disclosure: I/we have no positions in any stocks mentioned, and no plans to initiate any positions within the next 72 hours. (More…) I wrote this article myself, and it expresses my own opinions. I am not receiving compensation for it (other than from Seeking Alpha). I have no business relationship with any company whose stock is mentioned in this article.

Xcel Energy Is Entering A Bear Cycle

Summary EPA regulations are making coal generation facilities more costly to operate than ever before this is hurting XEL’s bottomline. Natural gas markets are fluctuating, and XEL’s stock price is inversely related. Summer is a seasonal low for natural gas prices, and as NG prices rise, XEL will fall. Xcel is a public utility company that is entering a bear cycle. While the Company pays a solid dividend which yields around 4% , its the revenues are stagnating. The Company has seen average residential electricity rates rise from 10.84 cents in 2012 to 11.89 cents in 2014. As these rates rise higher, solar and distributed generation become more economically attractive. Further, the price for Xcel’s energy is unlikely to decline in the near future, as the Company will have to upgrade its coal-fueled facilities to keep up with government regulation. Additionally Xcel’s stock price is inversely correlated to the natural gas market, when natural gas goes up, Xcel goes down. So if you believe as I do, that natural gas prices will increase over the next few years, Xcel is a sell. Company Positioning: from the 10-K Xcel Energy (NYSE: XEL ) is a holding company with subsidiaries engaged in the utility business. These subsidiaries are wholly owned public utilities that serve electric and natural gas customers in portions of Colorado, Michigan, Minnesota, New Mexico, North Dakota, South Dakota, Texas and Wisconsin. (click to enlarge) from the 10-K Coal is Xcel’s largest fuel input for electricity generation, it represents 46% of Xcel’s portfolio. Natural gas is the second largest with 21% of Xcel’s portfolio. The third largest is wind, with 15%. The Company has decreased its exposure to natural gas generation with approximately a -2% decrease from 23% of the portfolio in 2013 to 21% in 2014. (click to enlarge) from the 10-K As you can see from the table above, Xcel’s two major fuel sources , coal and nuclear, have low costs. Risk Management: from the 10-K (click to enlarge) from the 10-K Stagnating Electric Sales: If Xcel wants to make more revenue, it needs to increase electric sales across the board. It is a worry that there is a decline in growth of residential customers. Additionally Large C&I and Small C&I markets have stagnated. If this continues, Xcel will have difficulty growing. Environmental Regulations: The EPA is pursuing a regulatory path which will make it more costly to own and operate coal plants. These plants will have to be upgraded to stay inline with regulations. The Fluctuating Price for Natural Gas: The natural gas markets have finally leveled off after their long bear decline. Xcel has to effectively hedge against possible rising natural gas price levels to offset its fuel and supply costs. Dividends: (click to enlarge) from dividend.com (click to enlarge) from dividend.com XEL’s dividend historically ranges between $0.2 – $0.4 per share, however for three quarters of 2003 the dividend was not awarded at all. The period in 2003 is the only period which the stock has not paid dividends. The yield of the dividends are typically around 4%. Expert Opinions: (click to enlarge) from Yahoo Finance The median price estimate for XEL is $37 per share which gives the stock a 15.66% upside at its current price of $31.99. The stock has a beta of 0.34 which implies that the stock’s price is loosely related to the general market price. from Yahoo Finance XEL’s growth revenue is expected to slow down by 1% to 3.1% during 2016 year-over-year. Additionally, the Company’s EPS is expected to grow by 5.8% year-over-year. from Yahoo Finance The quarterly earnings growth for XEL was -41.8% year-over-year. Further quarterly revenue growth fell by -7.50% year-over-year. These are not good signs for a public utility company, whose revenues are dependent upon rate-making policy. Natural Gas Market: XEL has a negative correlation of -0.51 with United States Natural Gas Fund (NYSEARCA: UNG ) over a three year period. Summer is traditionally the season low pricing period for natural gas, as winter gets closer and closer we should begin to see the buyers enter to the market to hedge for winter exposures. Look for a seasonal up turn in natural gas markets as we near the end of summer. Recent News: White House recognizes Minneapolis and Xcel Energy for Web tool to help building owners track energy efficiency. Xcel Energy to begin inspecting transmission lines by helicopter Xcel Energy will use drone technology to protect and improve energy reliability and safety Xcel Energy named No. 1 utility wind provider for 11th consecutive year Conclusion: Xcel’s relationship with natural gas prices is really the major factor in recommending a sell of this stock. The natural gas market has been whip-sawing for the past year and considering we are currently near natural gas seasonal low, and with the adoption of LNG technology; natural gas seems poised for a climb. Xcel’s dividend is a healthy 4%, but they have cut the dividend in the past when the company hit hard times. There is little bright side to speak of, with quarterly revenue declines of -7.5% year-over-year and a total yearly revenue growth of only 3.1%. Further, the experts do not have a solid consensus regarding the future price of the stock. I recommend reducing exposure to XEL because of its risk associated with the natural gas market. Disclosure: I/we have no positions in any stocks mentioned, and no plans to initiate any positions within the next 72 hours. (More…) I wrote this article myself, and it expresses my own opinions. I am not receiving compensation for it (other than from Seeking Alpha). I have no business relationship with any company whose stock is mentioned in this article.

TYO: The Worst Inverse Bond ETF

Summary TYO has a high expense ratio. It is illiquid. The ETF is too volatile and does not adequately cover its underlying market. Introduction I have written a number of articles about my favorite inverse bond ETFs. I have also compiled a comprehensive list of the inverse bond ETFs I hate the most. I have discussed these securities extensively over the past few weeks, because I believe we are in an economic environment unavoidably poised to experience rising interest rates. Inverse bond ETFs can be used shrewdly to capitalize on this market inevitability, and they are valuable hedging tools for bond-heavy portfolios. However, there is long list of risks associated with investing in an inverse bond ETF, and it is prudent to research and analyze each security before investing. For this reason, I decided to write an article about the single worst inverse bond ETF on the market, the Direxion Daily 10-Year Treasury Bear 3X Shares ETF (NYSEARCA: TYO ). What Makes an Inverse Bond ETF Bad? When evaluating an inverse bond ETF, it is important for an investor to find a security that has a low expense ratio and correlates well to its underlying index. The three most important metrics for determining the quality of an inverse bond ETF are liquidity, expense, and coverage. A good inverse bond ETF has a low expense ratio, is highly traded, and maintains assets with wide coverage. A bad inverse bond ETF does just the opposite. Another metric that ought to be considered is the strength of the underlying institution that issues the inverse bond ETF. If the institution cannot honor an investment, an investor stands to lose everything. Another factor that ought to be considered is the inverse bond ETFs’ leverage multiple. Inverse Bond ETFs come in three sizes: 1X, 2X and 3X . 2X and 3X ETFs are designed to multiply the returns (or inverse returns) of the daily performance of an underlying index. 1X ETFs follow the daily returns of its underlying index one for one. Since 3X inverse bond ETFs track daily returns by three times, the risks already associated with inverse bond ETFs are exacerbated exponentially. Compounding risk greatly affects the returns of 3X ETFs particularly when tracking range-bound indexes. To read more about the risks of 2X and 3X leveraged ETFs, read my article here . TYO Analysis TYO is the worst inverse bond ETF because its expense ratio is high, it is not highly traded, it does not have wide coverage, and it is triple leveraged (which magnifies the risks associated with investing in it particularly for periods longer than one day). TYO is really the only option for 3X exposure to intermediate-term US Treasury bonds, however, just because it is the only option, does not mean it is a good option. It is the responsibility of issuing institutions to produce a good product that creates its own demand. TYO simply fails in all regards. I included a graph as more of a visual aid to show how TYO works. TYO Performance I included a graph mainly to show how TYO performs relative to its underlying index. The Direxion Daily 10-Year Treasury Bull 3X Shares ETF (NYSEARCA: TYD ) (green) is the 3X bull for 7-10 year Treasury bonds and TYO (orange) is the bear. I also included 10-year Treasury yields to show the correlation between bonds, yields and inverse bond ETFs. From a broad perspective, TYO is well correlated to 10-year yields and provides the results an investor would hope and expect from its underlying index TYD (about .99% correlation). TYO Analysis Continued On the surface, TYO seems to perform the job it is meant to perform. To see how TYO fails, one must examine the security closely. First, TYO’s net expense ratio is very high. The industry average for much more respected and liquid inverse bond ETFs is about 0.9%. Based on TYO’s total assets however, its average competitor has a net expense ratio of about 0.7%. TYO itself boasts one of the highest net expense ratios at 0.95% . What this means is, the investor must pay 0.95% just to hold TYO. The biggest risk of holding TYO, however, is its liquidity risk. It has an average volume of 10,228. TYO’s price is 18.15*10,228=$189,320. Basically, the ETF is off limits to any wealthier investors or money managing firms. Those who hold TYO run the risk of not being able to sell when they want, or causing a drop off in price when attempting to sell large volumes. Either way it’s a huge risk that can be avoided by investing in a more liquid inverse bond ETF. Lastly, TYO only has 49 million in total assets. It does not have an adequate amount of market exposure to fully correlate to changing market conditions. Conclusion The market speaks loudly and prices drive demand. An overpriced inversely leveraged ETF like TYO is going to have very little volume because investors do not want the risk. It is 3X leveraged, so it is designed to be inherently volatile. I can only imagine a poor investor losing money and being unable to sell their shares because no one is buying (or selling). Pick a better, more liquid ETF like the ProShares UltraShort 20+ Year Treasury ETF (NYSEARCA: TBT ) if you are trying to utilize an inversely leveraged ETF. Disclosure: I/we have no positions in any stocks mentioned, and no plans to initiate any positions within the next 72 hours. (More…) I wrote this article myself, and it expresses my own opinions. I am not receiving compensation for it (other than from Seeking Alpha). I have no business relationship with any company whose stock is mentioned in this article.