Tag Archives: function

Implications Of Sector Performances For 2015 Using Parametric Analysis
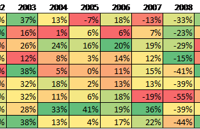
Over the past 16 years, on average, the top ranked sector had a return of 29% which is 9% points higher than the second performing sector. The spread from the top performing sector versus the bottom has consistently been 30% points or more and on average it was 40% points higher. Being a top third sector for four consecutive years has historically meant a drop in ranking of 4 spots. 2015 will be the year Health Care will mean-revert (XLV)(VHT). It is commonly known that things tend to move to the mean over time. What appears to be an aberration in the data from one observation is likely corrected in repeated observations. Virtually any repeated measurements of random data will converge to a bell-shaped curve. In statistics, this is called the central limit theorem (CLT). More specifically, the theorem suggests that the arithmetic mean of a sufficiently large sample of random iterations will be normally distributed. Whether the theory is fully understood or not, investors have been using the theorem to understand and make implications about the range of different market sector performances. If one sector has performed well in one year and outperformed the rest, it is anticipated that it will mean-revert at some point and underperform. This expectation of future performance is an application of the CLT. Note a major assumption behind this theorem is that the observations (in this case, sector total returns) must be independent and identically distributed. The assumption of independence has been a common topic of debate and we will avoid it here. This study looks at total returns for 9 US sectors using SPDR ETFs available for the past 16 years (1999 to 2014). A brief summary table of performances by year is given below: (click to enlarge) Looking at 2014, Utilities was the top performer followed by Health Care. Energy was the only sector below zero. From a 16-year compounded standpoint, Energy was the top with a 350% return which is 300% points above Technology and Financial sectors over the same time period. Next, is an analysis of comparable returns, sorting by rank. The table below is the same data with the performances ranked by year. For example, the #2 ranked sector in 2006 had a 19% total return. On average, the top ranked sector had a return of 29% which is 9% points higher than the second performing sector. The spread from the top performing sector versus the bottom has consistently been 30% points or more and on average it was 40% points higher. The standard deviation of returns across sectors in a given year has ranged from 4% (in 2006) to as high as 25% (in 2000). (click to enlarge) (click to enlarge) Parametric Scenario Analysis: I thought it would be interesting to evaluate a few scenarios and what it meant in the following year to help make some implications for 2015. First a quick summary on the current situation: Utilities and Health Care (NYSEARCA: XLV )(NYSEARCA: VHT ) were the top sectors in 2014, with Materials and Energy at the bottom Health Care has been a top performing sector: in the top 2 in both the prior two years and in the top 3 the all of the past 4 years Materials has been a laggard sector: a bottom 2 performer in the previous two years I first evaluated over the prior 15 years, what happened on average to the sector ranking in the following year. I did not look at absolute performance. For the top performing sector, the average ranking dropped the most to 5.9 in the following year. Similarly, the lowest performing sector increased the most in rank on average to 5.4. Next I looked at scenarios over consecutive periods. How has a sector performed after 2-4 years of excessive outperformance or underperformance? For example, I tracked the number of scenarios where a sector was the worst performer for 3 years in a row and what happened the following year (it happened once with Technology sector in 2000-2002 and in 2003 it rebounded to be the top performer). Some interesting findings over 1999-2013: A sector has never been the top performer for 3 consecutive years, nor has a sector ever been in the bottom third for four consecutive years A sector has been the worst performer for two consecutive years on 4 different occasions A sector in the bottom third for three consecutive years increased in rank by nearly 5 Implications for 2015: 1. Utilities and Health Care were the top sectors in 2014, with Materials and Energy at the bottom. History would suggest a reversion to the mean with Utilities being the worst impacted and the Energy benefiting. 2. Health Care has been a top performing sector: in the top 2 in both the prior two years and in the top 3 the all of the past 4 years Being a top performer for two years has not historically shown serious detrimental effects in the following year, however being a top third sector for four consecutive years has historically meant a drop in ranking of 4 spots. History would suggest Health Care will mean-revert. 3. Materials has been a laggard: a bottom 2 performer in the previous two years The prior 8 times this happened, the average ranking increased, but only to the 5th ranked sector. One more year in the bottom third would more conclusively imply outperformance on a historical standpoint.
The U.S. Economy’s Recovery Weighs On SLV

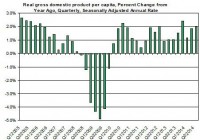
Summary The progress of the U.S. economy is keeping down SLV. The minutes of the last FOMC meeting may shed light on the next FOMC move. The upcoming non-farm payroll could also bring down SLV if it reaches or passes market expectations. The recovery of iShares Silver Trust (NYSEARCA: SLV ) any time soon remains questionable as the U.S. economy keeps showing signs of recovery and the FOMC is slowly setting the groundwork for a rate hike, which could be another blow for silver. Let’s take a closer look at the progress of the U.S. economy, examine what’s next for the FOMC and the relation to SLV. Is the U.S. economy doing better? The U.S. economy has improved in the past few quarters, albeit it has yet to return to its pre crisis levels (before the recent economic meltdown); let’s examine the U.S. GDP per capita. Data taken from FRED Between 2012 and 2014 the average annual growth rate (per quarter) was around 1.6% – back in 2000-2006 the average growth rate was 1.8% and in the second half of the ’90s this figure was 2.8%. Conversely, during 2010-2011 the average rise in GDP per capita was only 1.3%. So the growth rate has picked up, but it still has more room to improve. The progress of the U.S. economy is one factor that influences SLV investors whether or not to hold on to their investment. As the U.S. economy recovers, the demand for silver on paper tends to diminish as it did back in 2013-2014. Another important aspect to consider is the progress in the U.S. labor market, including employment and wages. (click to enlarge) Data taken from FRED Even though the number of non-farm payrolls have picked up, the U.S. hourly wages remained relatively flat in recent quarters. This turn of events could actually also play against SLV. If wages were to remain flat, this could suggest little growth in core inflation. If the U.S. inflation doesn’t rise, this could actually also reduce the demand for precious metals investments, including SLV. The upcoming non-farm payroll report will be released on Friday. (click to enlarge) Data taken from Bureau of Labor Statistics The market’s reaction tends to be negative to the news about the change in number of non-farm payroll. Current estimates put the number of added jobs at 241,000 – lower than in previous months but still inline with the average growth in jobs over the past year. Reaching this figure could set SLV for another tumble by the end of the week. Finally, this week the minutes of the last FOMC meeting will be released. This will come after the last meeting of 2014 revealed a change in wording of the statement. The Federal Reserve monetary policy tends to have a strong relation with the progress of the price of SLV. If the Fed were to turn more hawkish as it did in the past couple of years, this is likely to further reduce the demand for silver for investment purposes. Last time, the FOMC made some changes in the policy including omitting the term “considerable time” as a time frame for the next rate hike. But the wording didn’t seem to go down well as there were three dissenters to the decision. The minutes could provide some clarification about where the majority of the FOMC is leaning towards and additional information about their deliberations. In the past meeting, the FOMC members’ median outlook for the Fed’s rate at the end of 2015 was also slightly revised down from 1.375% to 1.125%. This is another indication that even though we could still see a rate hike by the middle of the year, the pace of increase may be slower than previously estimated. A rise in the rate and the progress of the subsequent rate hikes could adversely impact the price of SLV, which tends to be related to the Fed’s cash rate. If the U.S. economy keeps showing signs of improvement, the FOMC will be more likely to raise rates. This scenario isn’t likely to play off well for SLV. For more see: Will Higher Physical Demand for Silver Drive Up SLV? Disclosure: The author has no positions in any stocks mentioned, and no plans to initiate any positions within the next 72 hours. The author wrote this article themselves, and it expresses their own opinions. The author is not receiving compensation for it (other than from Seeking Alpha). The author has no business relationship with any company whose stock is mentioned in this article.

US Value Stocks: Rewriting The Market’s Playbook

Summary The traditional playbook that investors have used to navigate market cycles has become outdated. Certain sectors usually become inexpensive after the type of market run that we’ve experienced during the past few years. But investors are chasing yield, which has kept certain stocks expensive. Invesco’s US Value complex includes three broad strategies, each with a distinct approach to evaluating companies. Looking into 2015, we highlight where each approach is seeing the most attractive opportunities. By Kevin Holt The traditional playbook that investors have used to navigate market cycles has become outdated. Certain sectors usually become inexpensive after the type of market run that we’ve experienced during the past few years. But, because interest rates are so low, investors are chasing yield. That has kept certain stocks expensive when you wouldn’t normally expect them to be, based on past cycles. At the same time, other sectors look attractive when they would normally be out of favor. For example, when you look at market history, value investors would not typically want to own financials at this point in the cycle. However, as we enter 2015, I believe financials have very attractive valuations, along with a surplus of capital that I expect to be returned back to shareholders in the form of increased dividends and/or stock buybacks. Overall, I believe the quality of the financials sector is the best we’ve seen in at least a decade, and see this story playing out over the course of the next four or five years. On the other hand, I believe that broadly, the consumer staples and telecommunications sectors are either fairly valued or expensive, as investors have driven up valuations in their search for yield. However, as bottom-up stock pickers, all of our value managers are focused on finding value opportunities wherever they may be – even within sectors that may be overvalued as a whole. Invesco’s US Value complex includes three broad strategies. There are many ways to be successful and intellectual independence is a core value across our teams. Each strategy has a distinct approach to evaluating companies. Looking into 2015, here is where each approach is seeing the most attractive opportunities: Our relative value strategies look for companies that are inexpensive relative to their own history. In this space, we have a particular interest in energy stocks as we enter the new year. Often, market volatility can lead to value opportunities, as quality companies get swept up in the sell-off. The oil markets experienced significant volatility toward the end of 2014 that may result in such opportunities. Our deep value strategies look for companies that are trading at a discount to their intrinsic value. In this space, our managers are also emphasizing energy stocks as well as financials, for the reasons stated above. Our dividend value strategies closely evaluate companies’ total return profile, emphasizing appreciation, income and preservation over a full market cycle. Through this lens, they are finding stock-specific opportunities within the consumer area. Our dividend managers have a high confidence in the durability of margins and of free cash flow generation for their holdings over the next two to three years, and believe that expectations for top-line recovery embedded in street estimates are conservative. So, while 2015 may feel like a very different year for the markets, our approach is the same as ever – across all three value sleeves, and across large-, mid- and small-cap stocks, we’re looking for opportunities that fit our philosophy, no matter what the typical market playbook says. Important information A value style of investing is subject to the risk that the valuations never improve or that the returns will trail other styles of investing or the overall stock markets. Common stocks do not assure dividend payments. Dividends are paid only when declared by an issuer’s board of directors and the amount of any dividend may vary over time. Stocks of small and mid-sized companies tend to be more vulnerable to adverse developments, may be more volatile, and may be illiquid or restricted as to resale. The information provided is for educational purposes only and does not constitute a recommendation of the suitability of any investment strategy for a particular investor. Invesco does not provide tax advice. The tax information contained herein is general and is not exhaustive by nature. Federal and state tax laws are complex and constantly changing. Investors should always consult their own legal or tax professional for information concerning their individual situation. The opinions expressed are those of the authors, are based on current market conditions and are subject to change without notice. These opinions may differ from those of other Invesco investment professionals. NOT FDIC INSURED MAY LOSE VALUE NO BANK GUARANTEE All data provided by Invesco unless otherwise noted. Invesco Distributors, Inc. is the US distributor for Invesco Ltd.’s retail products and collective trust funds. Invesco Advisers, Inc. and other affiliated investment advisers mentioned provide investment advisory services and do not sell securities. Invesco Unit Investment Trusts are distributed by the sponsor, Invesco Capital Markets, Inc., and broker-dealers including Invesco Distributors, Inc. PowerShares® is a registered trademark of Invesco PowerShares Capital Management LLC (Invesco PowerShares). Each entity is an indirect, wholly owned subsidiary of Invesco Ltd. ©2014 Invesco Ltd. All rights reserved. blog.invesco.us.com