Warm Weather In Q1 Didn’t Diminish Portland General Electric’s Long-Term Outlook
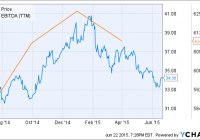
Summary Utility Portland General Electric’s Q1 earnings were dampened by unseasonably warm weather in Q1, which caused its sales volume to decline and earnings to miss the consensus estimate. The company would have had a solid quarter but for the mild winter, however, and it benefited from low fuel costs and a growing customer base. Weather aside, the company has continued to invest heavily in new non-coal capacity that will allow it to take full advantage of expected strong employment growth in its service area. While its shares appear to be undervalued at present, I would prefer to wait for them to fall to $31, a move that could occur with rising interest rates. Western electric utility Portland General Electric (NYSE: POR ) saw its share price approach a 52-week low earlier this month in the wake of a disappointing Q1 earnings report and subsequent downgrade by J.P. Morgan . While weather-related issues did negatively impact the company’s earnings earlier in the year, its trailing EBITDA is just short of a 15-year high (see figure). Furthermore, a disappointing short-term operating outlook co-exists with a more optimistic long-term outlook. This article evaluates Portland General Electric as a long-term investment in light of its recent performance and operating outlook. POR data by YCharts Portland General Electric at a glance Portland General Electric generates and distributes electricity from a number of fossil and renewable sources in the state of Oregon. The company’s most recent public iteration (its history as a firm dates to the late 19th century) came after it was divested from Enron in 2006 following the latter’s bankruptcy. Portland General Electric distributes electricity to 44% of Oregon’s inhabitants, with a total of 841,000 customers throughout the state, including much of the city of Portland (it divides service to the eponymous city with Berkshire Hathaway subsidiary Pacific Power ). The majority of Portland General Electric’s existing generating capacity , or 2,139 MW, comes from thermal power, split between roughly 65% natural gas and 35% coal. The company also utilizes substantial renewable sources, however, including 717 MW of wind power and 501 MW of hydroelectric power. A further 100 MW is purchased from third parties and resold by the firm. Oregon has recently begun to push companies in the state toward the replacement of fossil fuels with renewable resources, as evidenced by its March 2015 adoption of a low-carbon fuel standard. While the new standard is limited to transportation fuels, its implementation has led to proposals for the state to further adopt a carbon tax on fossil fuels, including fossil-based electricity. Recognizing the new trend, Portland General Electric will have phased out 61% of its coal-based capacity (i.e., its Boardman coal-fired facility) by 2020. As part of this effort the company is exploring the replacement of this capacity with biomass in a move that would create one of the largest biomass power facilities in the country. In the meantime it is building a new 440 MW natural gas-fired facility next to the existing Boardman coal-fired facility, thereby ensuring that its overall capacity will not be adversely affected by the closure of the coal-fired facility even in the event that biomass is not determined to be a feasible alternative feedstock. Portland General Electric is also moving forward with regulatory assessments of a new planned 6 MW hydroelectric dam in the state. As with other regulated electric utilities, Portland General Electric’s trailing earnings have been relative stable (see table). The most recent five quarters have been a strong rebound from 2013, however, when the company’s net income and EBITDA fell sharply. Overall it has been a consistent performer, however, reporting quarterly net losses on just two occasions in the nine years since it separated from Enron. As a regulated utility the company is dependent on state regulators to set rates at a level that will allow it to cover its cost of capital, and past earnings volatility has often been a result of regulators setting rates at levels below those requested by the company (the most recent example being the 2015 rates). Despite this most recent disappointment, however, Portland General Electric still manages to boast trailing net margin, return on equity, and return on assets figures that exceed the industry average. Portland General Electric Financials (non-adjusted) Q1 2015 Q4 2014 Q3 2014 Q2 2014 Q1 2014 Revenue ($MM) 473.0 500.0 484.0 423.0 493.0 Gross income ($MM) 250.0 239.0 222.0 214.0 255.0 Net income ($MM) 50.0 43.0 39.0 35.0 58.0 Diluted EPS ($) 0.62 0.52 0.47 0.43 0.73 EBITDA ($MM) 160.0 160.0 153.0 141.0 173.0 Source: Morningstar (2015) Portland General Electric also maintains relatively little cash on its balance sheet, with this amount falling to only $27 million at the end of Q1 (see table), relying instead upon steady operating cash flow and cheap credit to cover its substantial capital expenditures. At the end of Q1 the company listed $483 million in cash including short-term credit and letter of credit capacity maturing in November 2019. Furthermore, while it had an additional $2.1 billion in long-term debt at the end of the quarter, this was available at low rates (3.5% on 15-year debt, for example). While the company’s current ratio of 0.72 and substantial long-term debt load would be a cause for concern in other industries, Portland General Electric has no difficulty in acquiring additional financing as needed. Furthermore, its recent record of negative free cash flow has been the result of its large investments in additional capacity to meet demand growth in its service area, and these should pay substantial dividends (both figuratively and literally) as it comes online in 2017 and 2018. Portland General Electric Balance Sheet (restated) Q1 2015 Q4 2014 Q3 2014 Q2 2014 Q1 2014 Total cash ($MM) 27.0 127.0 97.0 97.0 64.0 Total assets ($MM) 7,091.0 7,042.0 6,657.0 6,399.0 6,169.0 Current liabilities ($MM) 809.0 873.0 482.0 457.0 451.0 Total liabilities ($MM) 5,152.0 5,131.0 4,768.0 4,528.0 4,313.0 Source: Morningstar (2015). Q1 earnings report Portland General Electric reported disappointing earnings in late April for Q1, missing on both lines. Revenue came in at $473 million, down 4.1% YoY from $493 million and missing the consensus estimate by $17.3 million. The company attributed the poor result to a substantial decline to sales volumes resulting from an unseasonably warm winter in its service area. Heating degree days in Q1 were down 21.7% from the previous year and 20% from the 15-year average, reducing demand as its customers were not forced to turn their heaters on as frequently as usual. The Q1 sales volume fell by 3.5% YoY, reducing revenue by $16 million. The company reported net income of $50 million, down from $58 million the previous year. Diluted EPS was $0.62 compared to $0.73 YoY, missing the consensus estimate by $0.10. EBITDA fell to $160 million from $173 million YoY. The company stated that diluted EPS would have been higher by $0.20 had the number of heating degree days for the quarter matched the 15-year average, while the expiration of the Production Tax Credit for wind power and abnormally low wind supply in the quarter reduced EPS by another $0.08. Partially offsetting these reductions was the sharp fall in the prices of natural gas and coal that occurred in the second half of 2014, which reduced the company’s operating costs by $23 million. Generation, transmission, and distribution costs rose 15% YoY but this was due to new capacity coming online. Finally, the company increased its number of retail customers by 0.7% YoY. But for the weather, then, Q1 would have been a solid quarter for the company. Indeed, the company’s management was confident enough in its overall performance to increase the quarterly dividend by 7% from $0.28 to $0.30 a week after the earnings report’s release, bringing its forward yield to a respectable 3.5%. Outlook Portland General Electric reported during its Q1 earnings call that its expansion plans are moving ahead as intended. The aforementioned new 440 MW Boardman natural gas-fired facility is on schedule to be mechanically completed by Q2 2016 and is on track to meet its estimated budget of $450 million. Its gas turbine and generator were installed in Q1 and its steam generator is expected to be constructed this quarter, bringing its overall construction to 50% completion. The company intends to finance its future capital expenditures, which could exceed $2.5 billion through 2018, via its operating cash flow ($494 million TTM), $400 million in new debt, and $270 million from equity forward sales that are due to be completed by the end of Q2. Finally, the company has requested a net 3.7% customer price increase for FY 2016 and expects state regulators to issue a decision by the end of 2015. Investors should note that the regulators have a history of awarding Portland General Electric lower-than-requested rate increases, however. Management stated in its Q1 earnings call that it is reducing its FY 2015 diluted EPS guidance from $2.20-$2.35 to $2.05-$2.20 in response to the weather-induced Q1 earnings miss. Beyond 2015, however, there are reasons to expect the company’s earnings to rebound. First, its Q1 earnings would have been stronger but for the quarter’s unseasonably warm weather. A return to the long-run average next year, let alone a colder-than-average winter such as the Northeast U.S. experienced at the same time, would provide its earnings with a boost. Similarly, the warm weather contributed to a record-low snowpack in Oregon that reduced the electricity yielded from Portland General Electric’s sizeable hydroelectric capacity, forcing it to increase its reliance on purchased power rather than its own generators. While there is no guarantee that next winter will provide a more favorable operating environment for the company, the 15-year average suggests that it will. Portland General Electric also benefits from operating in a state that has seen its labor rolls grow faster than the U.S. average since 2013 in a trend that is forecast to become particularly pronounced after 2017 (see figure). The company’s heavy investment in new capacity will, if the forecasts turn out to be correct, allow it to take full advantage of this trend by adding new customers and responding to increases in existing demand as economic growth strengthens still further. While its limited geographic exposure has been a burden at times in the past, Oregon’s expected above-average economic growth will similarly provide the company with an advantage over utilities in other parts of the country in coming years. Indeed, it could even make Portland General Electric a possible takeover target, although such an event is too speculative at present to have a large influence on an investment decision. Oregon Total Nonfarm Employment data by YCharts Finally, Portland General Electric can also be expected to benefit from last year’s sharp decline in the price of natural gas. While the fall hasn’t been as pronounced in Oregon as in the central and south-central U.S., the state is still experiencing citygate prices that are 21% lower today than at the same time a year ago (see figure). Continued low natural gas prices will provide the company with a couple of advantages. First, it places it in a position to take advantage of low prices and potentially invest in the acquisition of large natural gas reserves that can be utilized if and when prices increase in the future. Management stated during the Q1 earnings call that it is actively exploring such an investment, and I would expect to see the company move forward with it in the event that natural gas prices fall much further. Second, cheap natural gas increases the feasibility and reduces the opportunity costs of its move away from coal-fired facilities. Natural gas has less than half of the carbon intensity of coal when used to produce electricity and a switch from the latter to the former will both boost the company’s public image and mitigate the adverse impact of a possible carbon tax in the state. Oregon Natural Gas Citygate Price data by YCharts Valuation Not surprisingly, analyst estimates for FY 2015 have been revised lower over the last 60 days in response to management’s own lowered guidance. The diluted EPS consensus estimate for FY 2015 has fallen from $2.29 to $2.16, although the FY 2016 estimate has remained steady over the same period at $2.39. Based on the share price at the time of writing of $34.29, the company has a trailing P/E ratio of 16.8x. The consensus estimates result in forward ratios for FY 2015 and FY 2016 of 15.9x and 14.3x, respectively. While the trailing ratio is high compared to its 3-year history (see figure), the forward ratios are relatively low. POR PE Ratio (NYSE: TTM ) data by YCharts Conclusion Portland General Electric reported disappointing earnings for Q1 due to unseasonably warm conditions and investors have pushed the company’s shares near their 52-week low in response. While there are no guarantees that future weather conditions will be more favorable, even a return to the long-run average conditions would provide the company’s future earnings with a substantial boost. Beyond the current fiscal year, the company is continuing to invest heavily in new generating capacity, both as part of a move away from coal as well as in response to expectations of increased demand over the next several years as Oregon’s employment growth is forecast to substantially exceed that of the U.S. While Portland General Electric does not benefit from as friendly of a relationship with state regulators as many of its competitors do, I ultimately believe that this is outweighed by its geographic location and generating capacity investments. The only thing that prevents me from initiating a long investment at this time is the prospect of rising interest rates later in the year and movement of large investors away from utilities and other dividend stocks. I believe that the company’s share price could follow those of other dividend stocks lower in anticipation of a rate rise later in the year. Following such a decline, however, I would readily purchase Portland General Electric’s shares for $31, or approximately 13x its expected FY 2016 earnings. Disclosure: I/we have no positions in any stocks mentioned, and no plans to initiate any positions within the next 72 hours. (More…) I wrote this article myself, and it expresses my own opinions. I am not receiving compensation for it (other than from Seeking Alpha). I have no business relationship with any company whose stock is mentioned in this article.