Scalper1 News
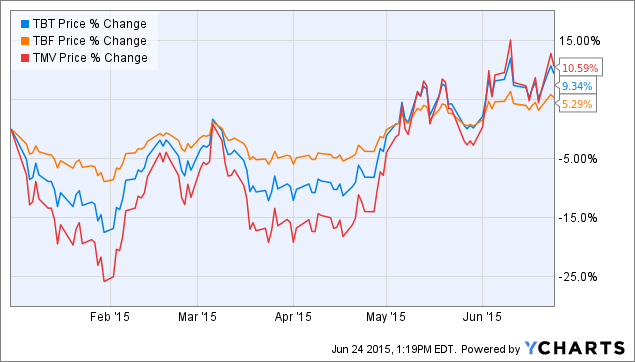
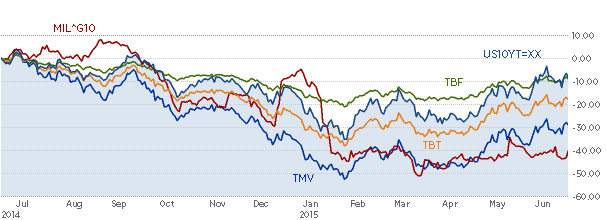 Summary TBT has the most volatility. TBT provides additional exposure through 2X leverage. TBT has more net assets than its competitors. Introduction In an economic environment where Interest rates are bound to rise in the coming months, a well performing inverse ETF is a good tool for any investor to have prepared. The best inverse bond ETF on the market is the ProShares UltraShort 20+ Year Treasury ETF ( TBT). TBT has over 2.70 Billion in net assets, and it seeks a return that is -2 times the return of the Barclays U.S. 20+ Year Treasury Bond Index for a single day. Inverse exposure is used to hedge against declines, seek profit from declines, and underweighting exposure to a market segment. I believe that TBT is the best inverse bond ETF on the market. Why TBT is the Best When interest rates rise, bond and bond index holders suffer. Inverse bond ETFs are valuable for investors with portfolios that are bond heavy or for investors trying to capitalize on rising interest rates. TBT has a 0.92% expense ratio and a 9.40% increase year to date. The industry average expense ratio hovers around 0.9%, and is comparable to TBT’s main competitors: the ProShares Short 20+ Year Treasury ETF (NYSEARCA: TBF ), the Direxion Daily 20+ Year Treasury Bear 3x Shares ETF (NYSEARCA: TMV ), and the ProShares UltraPro Short 20+ Year Treasury ETF (NYSEARCA: TTT ). What differentiates TBT is its 2x leveraged volatility, and its total assets. TMV has performed the best with returns of 12.80% YTD. TMV’s performance can be attributed to its 3X leverage which exposes it to the market more, but can also produce unwanted and potentially harmful volatility. TBF is 1x short and is less volatile, but TBF has only returned 5.84% YTD. Returns To show how TBT, TBF, and TMV move relative to each other, Included a comparison chart of returns year to date. Each index moves in a correlated manner, but the returns are different based on how leveraged each ETF is. Analysis Like its competitors, TBT shows a strong inverse (-.99) correlation to the 20 year index. Additionally, I compared TBT (in orange) and its competitors to the 10 year treasury. I did this to show how it correlates to, and can be utilized to hedge, 10-Year Treasury Bonds. The 10- and 20-Year Treasury move almost identically. As you can see, all four ETFs have a nearly perfect correlation to 10-Year yields. TBT and TBF, however, appear to be the most correlated. Yields and bond prices are inversely correlated, which allows one to hedge against rising interest rates. Each Inverse ETF accomplishes its goal of providing the investor with inverse exposure. Graph of 10-Year Treasury Yields This graph shows the relative performance of each aforementioned ETF relative to 10-Year Treasury Yields. I included this chart to show how each ETF produces different returns, yet each is correlated to the relative movement of the 10-Year. Analysis Continued TBT is the most heavily traded Inverse Bond ETF. TBT has an average volume of 3,364,979 while the second most traded is TBF with an average volume of only 785,380. Specialty 7-10/10 year inverse ETFs like the i Path U.S. Treasury 10-Year Bear ETN (NASDAQ: DTYS ) and the ProShares Short 7-10 Year Treasury ETF (NYSEARCA: TBX ) have average volumes of 53,418 and 11,371 respectively. A highly traded ETF like TBT avoids liquidity risk better than all of its competitors. Additionally, for investors wanting to move high volumes of equity in a short time period of time (without strongly affecting the price) TBT is your best bet. TBT is leveraged 2X to produce 2 times exposure to daily volatility. Some investors may not want to expose themselves to 2X leverage because it exposes them to additional risk than a direct 1X inverse ETF like TBF. For this reason, TBT is a better option for investors who are able to stomach risk well. I believe TBTs 2X exposure is hugely beneficial to long term performance. 3X exposure can be too volatile and unpredictable to trade effectively. 1X exposure does not provide adequate daily returns or hedging opportunity for those attempting to capitalize on market conditions. Finally, TBT has over 3 billion in total assets which allows TBT to track its underlying index more thoroughly than its competitors. TBT’s closest competitor, TBF, has only 1.1 Billion in total assets, while the average assets of its competitors fall closer to 100 million. Conclusion TBT is the best inverse bond ETF on the market. TBT provides high levels of exposure to yields while reducing additional risk that plagues its competitors. TBT has a fair expense ratio, and high correlation to its underlying index. For investors looking for ways to hedge against rising interest rates, TBT is clearly the superior ETF. Disclosure: I/we have no positions in any stocks mentioned, and no plans to initiate any positions within the next 72 hours. (More…) I wrote this article myself, and it expresses my own opinions. I am not receiving compensation for it (other than from Seeking Alpha). I have no business relationship with any company whose stock is mentioned in this article. Scalper1 News
Scalper1 News