Tag Archives: author

A Pareto (80/20) Portfolio To Start The New Year

Summary Using the 80/20 principle to create an outperforming portfolio. Outperforming the market and the average investor with fewer stock holdings. Holding fewer stocks makes managing a portfolio much easier. How many stocks is it necessary to hold in a portfolio in order to minimize risk and outperform the market and the average investor? What’s your opinion? Some of the contributors on SA hold 20, 30, 40 and even more than 50 stocks in their personal portfolios. I have no reason to criticize holding that many stocks in a personal portfolio, as that’s something that is, well, personal. Nevertheless, I don’t believe it’s necessary to hold so many stocks in a portfolio in order to beat the market and most investor’s returns. In fact, I believe that any investor, by simply choosing the right stocks, could create an out-performing portfolio with as few as five to ten stocks. This is based on the Pareto, or 80/20 principle. If you’re not familiar with the Pareto principle, what it states is that 80% of the results, outputs, or rewards are generated from only 20% of the causing inputs or efforts. You can read much more about the Pareto principle and its history here. Theoretically, this means that over a specific period of time, if you were holding 30 stocks in your portfolio, only about six of those stocks would have contributed to about 80% of the returns you enjoyed. Of course, this could be back-tested, which I would love to do but don’t have the will or time for right now. Now, many investors will immediately agree that a minority of their portfolio holdings contribute to a majority of their returns during a given time frame. But, they will argue, the reason for holding a larger number of stocks in one’s portfolio is because no one can pick which stocks are going to perform the best over a given time period. Although on the surface this argument seems to make sense, I am not presently convinced that this is true. So, with that in mind, I am going to use my own real money to find out if I can pick a few stocks and still outperform the overall market and even the average investor. Following is my Pareto Portfolio holdings at the present time. Stock Shares Buy Price Price at 2014/12/24 Change Avigilon Corp. ( OTCPK:AIOCF ) 290 23.4732C 17.25C -27% Cisco (NASDAQ: CSCO ) 125 26.2695U 28.30U +7.7% Coach (NYSE: COH ) 100 35.3175U 36.97U +4.7% Dream Office Reit T.D/UN 700 25.5122C 24.76C -3% Pembina Pipelines (NYSE: PBA ) 90 39.6206C 41.58C +5% Following are brief overviews of each company. Avigilon Corporation was founded in 2004. The company designs and manufactures high-definition video surveillance solutions. The company’s systems protect and monitor various locations worldwide and their customers include major corporations, government institutions, stadiums, retail environments, casinos, transportation stations, and more. Financial Highlights: 2008 to 2013 CAGR of 102% FY14 first nine months revenues of 191.9 million FY14 first nine months adjusted EBITDA and net income of 35.3 million and 22.2 million respectively FY14 projected revenues of 280 million projected revenues of 500 million by end of FY2016 the company does not pay a dividend Analysts Recommendations Recommendation Trends This Month Previous Month Strong Buy 1 1 Buy 8 9 Hold 0 0 Underperform 0 0 Sell 0 0 Cisco Systems was founded in 1984. The company designs, manufactures, and sells Internet Protocol (IP) based networking products and services related to the communications and information technology industry worldwide. It provides switching products and storage products, as well as offering service provider video infrastructure and collaboration products. Further, the company offers wireless products and provides technical support services and advanced services. The company serves businesses of various sizes, public institutions, telecommunications companies, other service providers, and individuals. Financial Highlights (Source: Valuentum ) 3-year historical Revenue CAGR of 2.9% and 5-year projected of 3.4%. 3-year historical EBITDA CAGR of 3.6% and 5-year projected of 7.4%. 3-year historical Net Income CAGR of 6.6% and 5-year projected of 8.6%. 3-year historical ROIC (without goodwill) is 56.4%, giving Cisco a ValueCreation rating of EXCELLENT . current Dividend Yield of 2.69% Analyst Recommendations Recommendation Trends Current Month Previous Month Strong Buy 10 9 Buy 16 16 Hold 11 11 Underperform 4 5 Sell 1 1 Coach was founded in 1941. The company provides luxury accessories and lifestyle collections for women and men in the U.S. and internationally. The company markets its products through a network of company-operated stores, including Internet in North America, and Coach-operated stores in and concession shop-in-shops in Japan, Mainland China, Hong Kong, Macau, Singapore, Malaysia, South Korea, the United Kingdom, France, Ireland, Spain, Portugal, Germany, and Italy. It also sells its products to wholesale customers and distributors in approximately 35 countries. Financial Highlights (Source: Valuentum) 3-year historical Revenue CAGR 4.9% of and 5-year projected of 2.9% 3-year historical EBITDA CAGR of (3.6%) and 5-year projected of 5.3% 3-year historical Net Income CAGR of (3.9%) and 5-year projected of 5.6% 3-year historical ROIC (without goodwill) of 106.7% giving Coach a ValueCreation rating of EXCELLENT. current Dividend Yield of 3.65% Analyst Recommendations Recommendation Trends This Month Previous Month Strong Buy 2 2 Buy 4 5 Hold 21 18 Underperform 4 4 Sell 1 1 Dream Office REIT (TSX:D.UN) Dream Office REIT is an unincorporated, open-ended real estate investment trust. The firm owns a portfolio of high-quality, well-located and attractively-priced business premises. The company’s portfolio comprises central business district and suburban office properties totaling approximately 24.7 million square feet of gross leasable area in major urban centers across Canada. Financial Highlights ttm Revenues of 757.26 million ttm EBITDA of 428.15 million ttm Diluted Earnings/Share of 1.95 Book Value per share of $35.27 ttm Dividend Yield of 9.05% Analyst Recommendations Ford Equity Research Buy N/A TD Securities Buy $31.00 price target CIBC World Markets Sector Perform $31.00 price target National Bank Sector Perform $31.00 price target Scotia Capital Sector Perform $31.75 price target RBC Capital Sector Perform $30.00 price target Pembina Pipeline Corporation Pembina Pipeline Corporation was founded in 1997. The company provides transportation and midstream services for the energy industry in North America. It operates through four segments: Conventional Pipelines, Oil Sands and Heavy Oil, Gas Services, and Midstream. The Conventional Pipelines segment operates 8,200 kilometers pipeline network and related facilities that transport crude oil, natural gas liquids, and conventional oil and condensate in Alberta and British Columbia. The Oil Sands and Heavy Oil segment owns and operates Syncrude, Horizon, Nipisi, and Mitsue Pipelines, as well as the Cheecham Lateral, which transports synthetic crude oil to oil sands producers. This segment operates approximately 1,650 kilometers of pipeline. The Gas Services segment operates natural gas gathering and processing facilities, including 4 gas plants and 12 compressor stations, as well as operates gathering pipelines. The Midstream segment has interests in extraction and fractionation facilities; and provides terminalling and storage hub services. Financial Highlights ttm Revenues of 5.34 billion ttm EBITDA of 879.06 million ttm Net Income of 319.82 million ttm Diluted Earnings/share of $1.00 ttm Dividend Yield of 4.30% Analyst Recommendations Company Recommendation 12-month Price Target RBC Capital Outperform $51.00 TD Securities Buy $57.00 National Bank Outperform $55.00 CIBC World Markets Outperform $55.00 Scotia Capital Outperform $52.00 Haywood Securities Buy $57.00 There is only one rule I will follow regarding this portfolio. At no time can I exceed holding 10 stocks at one time. Other than that, I can add to any of the current positions at any time, I can add new positions at any time and I can sell any portion of or all of a position at any time. The point is to see how well this portfolio will perform in 2015 against the overall market. I will immediately update my readers of any additions to or changes I make to the portfolio. I’ll also do a complete update of the portfolio’s progress at the end of each month. I’m very interested in seeing how this Pareto Portfolio is going to do and I’ve love to hear your comments, ideas, feedback too. Additional disclosure: I am also long on the Dream Office REIT, symbol D.UN on the TSX.
Herzfeld Caribbean Basin Fund: Sell This CEF As It Jumps To Massive Premium

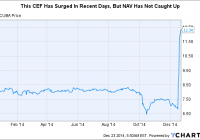
As the United States and Cuba have announced their intentions to normalize diplomatic relations, investors are excited by the prospect of economic investment in the Caribbean island nation. This has led to an over 81% jump in the shares of the Herzfeld Caribbean Basin Fund which has advanced to a 50.3% premium to NAV. Despite the fund’s ticker symbol (CUBA), the CEF has no direct exposure to Cuba and holds listed securities in a portfolio that could be built independently without such a premium. Shares of the Herzfeld Caribbean Basin Fund (NASDAQ: CUBA ) have surged by 81.2% in the past four trading sessions after the United States and Cuba announced their intentions to normalize their international relations. While the closed end fund has recently traded at a discount to NAV, the four-day rally has put the CEF at a 50.3% premium to Monday’s closing NAV. Investors have expressed optimism over the potential economic benefits of further diplomatic cooperation between the U.S. and Cuba; however, the fund does not actually own any non written off assets domiciled in Cuba. The fund lists the following as part of its investment objective: “The fund invests at least 80% of its total assets in a broad range of securities of issuers including U.S.-based companies that engage in substantial trade with, and derive substantial revenue from, operations in the Caribbean Basin Countries.”-Herzfeld Caribbean Basin Fund Investment Objective The fund’s ticker symbol has likely led to retail investor optimism despite the fund’s composition and the significant premium that it has jumped to. The Herzfeld Caribbean Basin Fund has AUM in the $30 Million range and charges a management fee of 1.45% of average daily net assets in addition to other expenses that amounted to roughly $270 thousand last fiscal year equating to a total annual expense ratio of around 2.4%. In addition to the concerns over the small size of the fund, other than in the past few trading sessions, it has experienced low levels of liquidity and trading volume. Having traded at a roughly 10% discount to NAV in its recent history, it is rather concerning that it has jumped to a 50.3% premium to NAV. CUBA data by YCharts Two Written-Off Assets May Be Reason For Investor Over-Optimism While the Herzfeld Caribbean Basin Fund owns shares of companies that would benefit from improved US-Cuba relations and general Cuban economic growth, however the fund does not actually own shares in any Cuban-domiciled corporations. The company does in fact have two written-off and transfer restricted Cuban assets both with a fair value of $0: $165 Thousand par Republic of Cuba bonds, 4.5%, 1977 that is in default and 700 shares of Cuban Electric Company that have a fair value of $0. Even if these assets were to surprisingly realize any sort of value, it would not likely be of any material significance to the fund. Rights Offering Proceeds Used To Both Fund Capital Gains Distribution And Add Capital To The CEF Earlier in December, the fund completed an oversubscribed rights offering that raised new capital for the CEF. The Herzfeld Caribbean Basin Fund sold 1.8 million shares at $6.77 per share equating to roughly $12.1 million in cash proceeds. Last Thursday, the fund announced its year-end distribution that will amount to $0.635 per share consisting of mostly long-term capital gains and some short-term capital gains. The recent rights offering will provide the necessary liquidity to pay the year-end distribution and will also leave the fund with extra capital to deploy as it sees fit. Additionally, two key members of the fund’s management hold large stakes in the CEF: Thomas J. Herzfeld, the chairman of the board, president and portfolio manager holds an 11.3% stake while his son, Erik M. Herzfeld who serves as a portfolio manager owns just over a 5% stake. While Cuba’s Economic Situation May Improve Materially, This Potential Does Not Provide Reason To Pay A 50.3% Premium For A Related Fund The latest news of increased international cooperation between the U.S. and Cuba may certainly have positive long-term impacts for Cuba’s economy. It may open the door for direct foreign investment to boost the country’s infrastructure and to draw in new capital. Cuba certainly has the potential to bring in mass amounts of tourist over the long term from a number of nations including the U.S. However, at 50.3%, the Herzfeld Caribbean Basin Fund does make a sensible investment decision. If an investor were so inclined to mimic the portfolio of the CEF, one could without paying such an immense premium to NAV. The recent news boosts the prospects for Cuba’s economy; however, investors should avoid the Herzfeld Caribbean Basin Fund as it trades at a massive premium and does offer direct exposure to the country. Note: Pricing is accurate as of the close of trading on Monday Dec. 22, 2014.

Considering SCHF For Foreign Exposure? Modern Portfolio Theory Can Use It

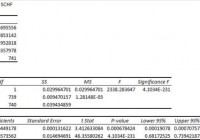
Summary I’m taking a look at SCHF as a candidate for inclusion in my ETF portfolio. The risk level is relatively high for just holding SCHF, but the correlation to the S&P 500 fixes that. The ETF has a solid dividend yield and diversified holdings. I’m not assessing any tax impacts. Investors should check their own situation for tax exposure. Investors should be seeking to improve their risk adjusted returns. I’m a big fan of using ETFs to achieve the risk adjusted returns relative to the portfolios that a normal investor can generate for themselves after trading costs. I’m working on building a new portfolio and I’m going to be analyzing several of the ETFs that I am considering for my personal portfolio. One of the funds that I’m considering is the Schwab International Equity ETF (NYSEARCA: SCHF ). I’ll be performing a substantial portion of my analysis along the lines of modern portfolio theory, so my goal is to find ways to minimize costs while achieving diversification to reduce my risk level. What does SCHF do? SCHF attempts to track the total return of FTSE developed ex-US Index. The ETF falls under the category of “Foreign Large Blend.” Funds within this category generally invest most of their assets in developed markets. Some will include a small exposure to emerging markets, but different investment managers have different definitions of which markets are “emerging” and which ones are “developed.” Does SCHF provide diversification benefits to a portfolio? Each investor may hold a different portfolio, but I use (NYSEARCA: SPY ) as the basis for my analysis. I believe SPY, or another large cap U.S. fund with similar properties, represents the reasonable first step for many investors designing an ETF portfolio. Therefore, I start my diversification analysis by seeing how it works with SPY. I start with an ANOVA table: (click to enlarge) The correlation is about 76%, which is low enough that I’m expecting to see significant diversification benefits. Standard deviation of daily returns (dividend adjusted, measured since January 2012) The standard deviation isn’t going to make a strong case for investing in SCHF. For the period I’ve chosen, the standard deviation of daily returns was 0.8955%. For SPY, it was 0.7300% over the same period. Clearly, SPY appears to be the safer of the two investments. Mixing it with SPY I also run comparisons on the standard deviation of daily returns for the portfolio assuming that the portfolio is combined with the S&P 500. For research, I assume daily rebalancing because it dramatically simplifies the math. With a 50/50 weighting in a portfolio holding only SPY and SCHF, the standard deviation of daily returns across the entire portfolio is 0.7865%. The risk level on the portfolio drops relative to only holding SPY because of the diversification benefits that come from the 76% correlation. If the position in SPY is raised to 80% while SCHF is used at 20%, the standard deviation of daily returns drops down to 0.7453%. In practice, I think the best way to use SCHF will be a position smaller than 20% and used in a more diversified portfolio. The low correlation makes a very strong case for using SCHF in a small position to enhance diversification. Currently, I’m thinking my exposure to developed markets should be around 5%. At 5%, the standard deviation of the portfolio would be 0.7329%. This is hardly higher than simply holding SPY and indicates that most of the additional risk from the higher standard deviation has been effectively diversified away. Why I use standard deviation of daily returns I don’t believe historical returns have predictive power for future returns, but I do believe historical values for standard deviations of returns relative to other ETFs have some predictive power on future risks and correlations. Yield and Taxes The distribution yield is 2.26%. The SEC 30-day yield is 2.49%. Those yields aren’t bad and make this ETF look attractive as part of a dividend portfolio. However, the ETF invests in foreign securities and I’m not a CPA or CFP. Investors concerned about tax consequences should seek advice from someone knowledgeable about their tax situation. Expense Ratio The ETF is posting .08% for an expense ratio, which is very low. Market to NAV The ETF is trading at a .45% premium to NAV currently. In my opinion, a .45% premium to NAV is a problem for new investors. I think the ETF is significantly less attractive when it trades above NAV. A .10% premium isn’t too bad in my opinion, but .45% bothers me. It’s not terrible, but I’d be cautious about that. Largest Holdings The diversification within the ETF is excellent, as shown by the following chart: (click to enlarge) I don’t love having my portfolio invested in U.S. Dollars (my checking account gives me that exposure), but I can understand the ETF needing to have some cash. With no company over 1.5%, that diversification is great. I have not performed individual research on the holdings, but with no exposure over 1.5%, I don’t think there is a viable case for returns on time in researching the individual holdings. Investing in the ETF is largely relying on modern portfolio theory. The argument for the investment is the respectably low correlation of the portfolio to the major U.S. index funds. Making an investment requires a belief that markets are at least somewhat efficient so that the companies within the portfolio will be reasonably priced. Conclusion I’m currently screening a large volume of ETFs for my own portfolio. I’ll do a little more digging on SCHF later and post what I find. The portfolio I’m building is through Schwab, so I’m able to trade SCHF with no commissions. I have a strong preference for researching ETFs that are free to trade in my account. I think SCHF will merit a fairly small position within that ETF portfolio. The low correlation and the low expense ratio are the driving factors for me. Additional disclosure: Information in this article represents the opinion of the analyst. All statements are represented as opinions, rather than facts, and should not be construed as advice to buy or sell a security. Ratings of “outperform” and “underperform” reflect the analyst’s estimation of a divergence between the market value for a security and the price that would be appropriate given the potential for risks and returns relative to other securities. The analyst does not know your particular objectives for returns or constraints upon investing. All investors are encouraged to do their own research before making any investment decision. Information is regularly obtained from Yahoo Finance, Google Finance, and SEC Database. If Yahoo, Google, or the SEC database contained faulty or old information it could be incorporated into my analysis. The analyst holds a diversified portfolio including mutual funds or index funds which may include a small long exposure to the stock.