Tag Archives: author

Competition Heats Up In The Global Tactical ETF Space

With the launch of the Cambria Global Asset Allocation ETF (NYSEARCA: GAA ), Cambria Funds looks to compete with the AdvisorShares ETF that Cambria previously managed; and with the new zero-management fee alternative mutual fund offered by Aspiration Funds. The Cambria Global Asset Allocation ETF debuted on December 9. The ETF’s objective is to replicate the results of the Cambria Global Asset Allocation Index, which allocates assets across asset classes in pursuit of absolute positive returns. Investing in the new ETF will provide investors with exposure to stocks, bonds, commodities, and currencies, diversified across geographic markets and economic sectors. While Aspiration Funds made headlines with their innovative “name your own price” management fees, the new alternative ETF from Cambria Funds goes even further, with a flat management fee of 0.00% (that’s not a typo). Being an ETF, the new Cambria fund doesn’t charge a 12b-1 fee, either, and its net-expense ratio is just 0.29%. The only catch to the ultra-low fees is that the new ETF invests in other ETFs, some of which are managed by Cambria, and the underlying ETF managers will collect management fees. The Cambria Global Asset Allocation ETF typically invests in other ETPs (exchange-traded products), with roughly 40% of its assets allocated to equities, 40% to fixed-income, and 20% to other asset classes such as commodities and currencies. The goal is to gain diversification benefits through asset allocation, in order to dampen volatility, limit drawdowns, and keep investors in the market, long-term, so that their gains can compound. Cambria Investment Management serves as the new ETF’s investment advisor, and its portfolio managers are Mebane Faber and Eric Richardson. Previously, Cambria managed a similar ETF for AdvisorShares, now known as the AdvisorShares Morgan Creek Global Tactical ETF (NYSEARCA: GTAA ) and managed by Mark Yusko of Morgan Creek Capital. Through December 22, GTAA had gained 4.6% in 2014, but its net-expense ratio of 1.63% is 134 basis points higher than GAA’s. 2015 is shaping up to be a big one for liquid alts, and the competition between these ETFs likely foreshadows many similar showdowns to come. Liquid alts investors, who gain additional investment options and benefit from the downward pressure on fees, have reason to look forward to the New Year. For more information, visit the new fund’s website .

Country CAPE Ratios: Wizard In 2013, Dunce In 2014?

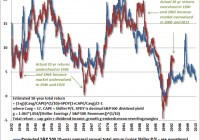
Summary The CAPE ratio was a fantastic predictor of country returns in 2013. In March 2014, Mebane Faber and Cambria Investments launched GVAL, which uses CAPE-like methodologies to buy the cheapest global markets. How did CAPE and GVAL do in 2014? Introduction As followers of my Buy-the-Dip High-Yield portfolio would know, I am a value investor at heart. The fact that value stocks outperform growth stocks has been proven by ample academic research, and is also attested to by the legendary value investor Warren Buffett’s remarkable track record over the years. One commonly used measure to determine market valuation is the cyclically-adjusted price-earnings [CAPE] ratio, also known as the Shiller P/E ratio. This metric was developed by U.S. economist and Nobel laureate Robert Shiller, and is defined as price over 10-year average earnings adjusted for inflation. By using 10-year average earnings rather than one-year trailing (or forward) earnings, fluctuations in net income caused by variations in profit margins over a typical business cycle can be reduced. The use of CAPE as a valuation indicator does have its limitations. While high CAPE values have been associated with lower future long-term returns, and lower CAPE values with higher future long-term returns, the CAPE ratio does not reliably predict near-term tops and bottoms. In a chart from a December 2013 article by Hussman Funds entitled ” Does the CAPE still work? “, the projected 10-year returns predicted by CAPE was found to correlate nicely (> 90%) with actual 10-year returns, except when markets became very overvalued or very undervalued . (click to enlarge) (Image from Hussman Funds) The current CAPE ratio of the U.S. market (27.33) is significantly higher than both its historical average (16.58) and median (15.95), suggesting moderate overvaluation of the market, and thus, low future returns. However, the above commentary from Hussman Funds states that actual returns can exceed CAPE forecasts when stocks become overvalued (“Actual 10-yr. returns overshoot in 1990 and 2003 because market overvalued in 2000 and 2013”). My own interpretation of this is that if the U.S. market were to remain overvalued for the next couple of years, then the subsequent returns could be greater than what is currently predicted by CAPE. However, Hussman Funds is seemingly confident that would not be the case: The CAPE Ratio is doing exactly what it has always done, which is to help investors anticipate the investment returns they should expect over the next decade. Those returns will very likely be in the low, single digits. Country CAPE Does value investing work for countries? According to Mebane Faber, co-founder and Chief Investment Officer at Cambria Investments, the answer is a resounding “yes”. In a January 2, 2014 posting on his “Meb Faber Research” website, Faber points out that the countries with the cheapest CAPE ratios massively outperformed those with the highest CAPE ratios in 2013. The bottom-5 and bottom-10 CAPE countries averaged 20.74% and 21.11% returns, respectively, in 2013, while the top-5 and top-10 CAPE countries averaged -17.81% and -5.39%, respectively. This represents a differential of 38.59% for the top-5 versus bottom-5, and 26.5% for the top-10 versus bottom-10, a remarkable outperformance. (Image from Meb Faber Research ) I compiled the total return performances into a bar chart. Blue bars represent the cheapest countries, red bars represent expensive countries. Countries are sorted from left to right, in order of increasing CAPE values. I have also compiled the data into a scatterplot, to show the relationship between CAPE on the December 31, 2012 and 2013 returns. On the face of it, the divergence between the most expensive and the cheapest stocks in 2013 was pretty dramatic. Even with the outliers (Russia and USA) present, a statistical test conducted on this data revealed that the negative correlation was highly significant (p-value = 0.00018). In other words, countries with high CAPE values showed lower 2013 returns, while countries with low CAPE values showed higher 2013 returns. These results, therefore, suggested that CAPE was an excellent metric for identifying cheap markets to obtain outsized returns. Three months later, Cambria debuted the Cambria Global Value ETF (NYSEARCA: GVAL ), an ETF fund (with a relatively high 0.69% expense ratio for a passive fund) that uses CAPE-like methodologies to invest in the cheapest markets globally. Coincidence? Maybe. How good was CAPE as a valuation measure in 2014? Last year, Faber had actually pre-empted his new year’s article with a December 5, 2013 posting that showed the impressive performance of the CAPE indicator through the first 11 months of 2013. Unfortunately, he had chosen not to do so again this year. Therefore, I took it upon myself to obtain data for CAPE ratios for countries from the start of the year and compare those with their YTD performances. 2014 Country CAPE Evaluation Meb Faber updated his CAPE ratios at the start of the year. As reported by Seeking Alpha : Mebane Faber updates countries’ cyclically-adjusted price-earnings ratios for the start of the year, and Greece, Russia, Ireland, Argentina, Hungary, Jordan, Austria, and Lebanon make the list of the cheapest – all under 10. How did the CAPE do in 2013? If you bought the 5 highest-priced countries – Peru, Colombia, Indonesia, Mexico, and Chile – you would have lost 17.8%. If you bought the 5 cheapest – Greece, Ireland, Argentina, Russia, and Italy – you would have gained 20.7%. Unfortunately, I do not have a subscription to The Idea Farm, Faber’s subscription service, and so could not access Faber’s updated list of CAPE ratios. Therefore, bits and pieces of data were instead obtained from StreetAuthority and from StarCapital . In the table below, CAPE ratios for countries marked with (^) are from StreetAuthority, and are from 12/11/2013. CAPE ratios for the remaining countries are from StarCapital, and are from 1/31/2014. Although the two sets of CAPE data originate from time points nearly two months apart, I reasoned that it should not have a large effect on the analysis, because CAPE is a long-term measure of valuation. 2014 YTD return data are from Morningstar . Country ETF CAPE 2014 YTD % Greece (NYSEARCA: GREK ) 4.03 -36.35 Argentina^ (NYSEARCA: ARGT ) 6.91 -3.12 Ireland^ (NYSEARCA: EIRL ) 6.94 0.67 Russia^ (NYSEARCA: RSX ) 7.11 -42.54 Jordan^ 8.64 Italy (NYSEARCA: EWI ) 8.8 -7.98 Austria^ (NYSEARCA: EWO ) 9.16 -19.47 Hungary^ 9.46 Croatia^ 9.81 Lebanon^ 9.97 Israel^ (NYSEARCA: EIS ) 9.98 -1.39 Spain (NYSEARCA: EWP ) 10.3 -2.22 Belgium (NYSEARCA: EWK ) 12.2 4.81 Norway (NYSEARCA: NORW ) 12.3 -21.68 United Kingdom (NYSEARCA: EWU ) 12.6 -5.77 Singapore (NYSEARCA: EWS ) 12.9 2.6 France (NYSEARCA: EWQ ) 13.8 -7.97 Netherlands (NYSEARCA: EWN ) 14.5 -3.53 Australia (NYSEARCA: EWA ) 16.2 -4.73 Germany (NYSEARCA: EWG ) 17.3 -9.51 Hong Kong (NYSEARCA: EWH ) 18.2 3.15 Canada (NYSEARCA: EWC ) 18.6 1.57 Switzerland (NYSEARCA: EWL ) 21.6 0.28 Japan (NYSEARCA: EWJ ) 23.9 -4.22 USA (NYSEARCA: SPY ) 24.6 14.68 The 2014 YTD total return performances have also been compiled into a bar chart. Blue bars represent the cheapest countries (CAPE

Time To Go Shopping For Retail ETFs

Summary Strength in retail was a major factor in the Q3 U.S. GDP read. The sector looks very strong going into 2015. The ETFs discussed in this article provide easy and affordable access to the sector. The latest read on U.S. GDP growth surprised many. Analysts were expecting a pretty big number, but Q3 growth of 5% smashed estimates. With the energy sector, oil especially, in a steady decline, some have been left scratching their heads as to where this growth is coming from. After a sustained slump, it looks like retail is back in the game, especially going into Q4. The sector overall is looking good, as lower gas prices and higher employment leave consumers with more money to spend on discretionary items. Retail back in business According to some of the macro numbers that have been released recently, the retail sector seems to be picking up strength as we near the end of the year. November retail sales rose 0.7% year-over-year for the best performance in eight months, beating estimates for a 0.4% increase, in part due to falling oil prices and increased employment. In fact, gas prices are at their lowest point in four years, and the hiring increase has been the largest in over a decade. Higher spending is distributed quite evenly across product categories, such as electronics and furniture, although car sales seem to be doing particularly well. Sales of cars and light trucks hit an annualized rate of 17.1 million in November, up from 16.4 million in the month before. Excluding autos, retail sales rose 0.5% versus an expected 0.1%. The fact that consumers are spending their higher disposable income instead of squirreling it away is encouraging, and indicates that consumers are optimistic about the economy. Things aren’t expected to slow down in Q4 either. Growth of 5% in Q3 GDP came in well ahead of a previous estimate of 3.9%, and comes on top of a 4.6% increase last quarter after a fairly easy comp with last year’s harsh winter. There are a host of indications that the U.S. economy may be shifting gears. Personal spending jumped 0.6% together with a 0.4% rise in personal income. This strong performance is expected to carry over into Q4, with projected growth revised up to 2.8% from a previous 2.6%. Getting in For investors looking to ride the strength of the U.S. consumer, without putting in too much effort, retail ETFs look like a good bet. Let’s take a look at a few of the options in the consumer discretionary space. As usual, the obvious choice is SPDR’s offering: the S&P retail ETF (NYSEARCA: XRT ). With around $1.7 billion in AUM, it’s the largest and also the most liquid. The expense ratio is fairly low at 0.35%. A bit pricey at around 19 times trailing earnings overall, the ETF is up around 8% year-to-date. Its three biggest holdings are Whole Foods (NASDAQ: WFM ), Tractor Supply (NASDAQ: TSCO ) and L Brands (NYSE: LB ), and some 74% of its holdings are classed under consumer cyclicals, making it a slightly more volatile play than the next ETF choice. Another option, and one which has performed considerably better, is the Market Vectors Retail ETF (NYSEARCA: RTH ), which is up 17% so far this year. A more defensive option, roughly 38% of the ETFs holdings are in the consumer defensive space. Its three biggest holdings are Wal-Mart (NYSE: WMT ), Amazon (NASDAQ: AMZN ) and Home Depot (NYSE: HD ). At an expense ratio of 0.35%, it’s fairly inexpensive, and the P/E ratio of 19 times trailing earnings is also in line with SPDR’s comparable ETF. A more actively managed choice would be Powershares Dynamic Retail (NYSEARCA: PMR ). This active management results in a higher expense ratio of 0.63%, and the ETF is up around 11% so far this year. At the moment, its top holdings are Costco (NASDAQ: COST ), Kroger (NYSE: KR ) and O’Reilly Automotive (NASDAQ: ORLY ). All stocks in the basket are screened on a number of fundamental growth metrics, and are moved up or down in weight accordingly. As it has not outperformed the Market Vectors Retail ETF, and is pricier in terms of expense ratio, this one looks a bit less enticing. For me, Market Vectors’ offering looks like the best bet due to its low expense ratio, solid performance this year, and relatively defensive character. However, all three will do a good job in providing a portfolio with some exposure to strength in U.S. retail. Conclusion There are now tangible signs that the U.S. economy is picking up steam, with a huge Q3 GDP beat fueling expectations for further growth. Retail sales have been a major driver behind this increase, and the sector looks excellent going into the holiday season. The three ETFs discussed here provide affordable and efficient access to the consumer discretionary sector, and getting in before the holiday figures come in could provide some very decent returns going into 2015.