Scalper1 News
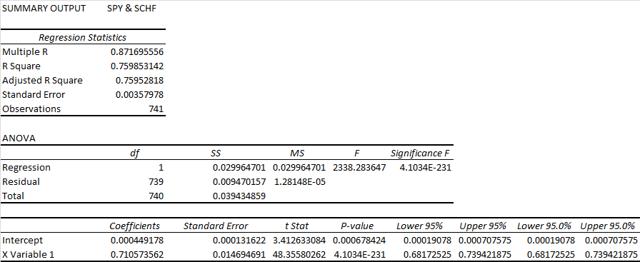
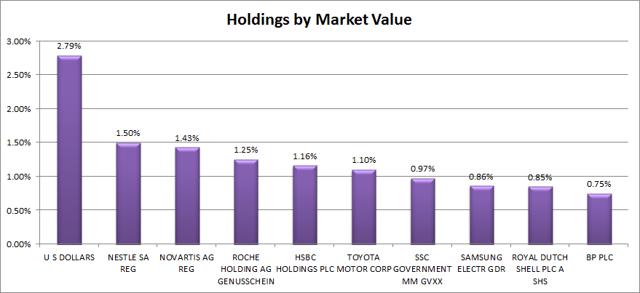 Summary I’m taking a look at SCHF as a candidate for inclusion in my ETF portfolio. The risk level is relatively high for just holding SCHF, but the correlation to the S&P 500 fixes that. The ETF has a solid dividend yield and diversified holdings. I’m not assessing any tax impacts. Investors should check their own situation for tax exposure. Investors should be seeking to improve their risk adjusted returns. I’m a big fan of using ETFs to achieve the risk adjusted returns relative to the portfolios that a normal investor can generate for themselves after trading costs. I’m working on building a new portfolio and I’m going to be analyzing several of the ETFs that I am considering for my personal portfolio. One of the funds that I’m considering is the Schwab International Equity ETF (NYSEARCA: SCHF ). I’ll be performing a substantial portion of my analysis along the lines of modern portfolio theory, so my goal is to find ways to minimize costs while achieving diversification to reduce my risk level. What does SCHF do? SCHF attempts to track the total return of FTSE developed ex-US Index. The ETF falls under the category of “Foreign Large Blend.” Funds within this category generally invest most of their assets in developed markets. Some will include a small exposure to emerging markets, but different investment managers have different definitions of which markets are “emerging” and which ones are “developed.” Does SCHF provide diversification benefits to a portfolio? Each investor may hold a different portfolio, but I use (NYSEARCA: SPY ) as the basis for my analysis. I believe SPY, or another large cap U.S. fund with similar properties, represents the reasonable first step for many investors designing an ETF portfolio. Therefore, I start my diversification analysis by seeing how it works with SPY. I start with an ANOVA table: (click to enlarge) The correlation is about 76%, which is low enough that I’m expecting to see significant diversification benefits. Standard deviation of daily returns (dividend adjusted, measured since January 2012) The standard deviation isn’t going to make a strong case for investing in SCHF. For the period I’ve chosen, the standard deviation of daily returns was 0.8955%. For SPY, it was 0.7300% over the same period. Clearly, SPY appears to be the safer of the two investments. Mixing it with SPY I also run comparisons on the standard deviation of daily returns for the portfolio assuming that the portfolio is combined with the S&P 500. For research, I assume daily rebalancing because it dramatically simplifies the math. With a 50/50 weighting in a portfolio holding only SPY and SCHF, the standard deviation of daily returns across the entire portfolio is 0.7865%. The risk level on the portfolio drops relative to only holding SPY because of the diversification benefits that come from the 76% correlation. If the position in SPY is raised to 80% while SCHF is used at 20%, the standard deviation of daily returns drops down to 0.7453%. In practice, I think the best way to use SCHF will be a position smaller than 20% and used in a more diversified portfolio. The low correlation makes a very strong case for using SCHF in a small position to enhance diversification. Currently, I’m thinking my exposure to developed markets should be around 5%. At 5%, the standard deviation of the portfolio would be 0.7329%. This is hardly higher than simply holding SPY and indicates that most of the additional risk from the higher standard deviation has been effectively diversified away. Why I use standard deviation of daily returns I don’t believe historical returns have predictive power for future returns, but I do believe historical values for standard deviations of returns relative to other ETFs have some predictive power on future risks and correlations. Yield and Taxes The distribution yield is 2.26%. The SEC 30-day yield is 2.49%. Those yields aren’t bad and make this ETF look attractive as part of a dividend portfolio. However, the ETF invests in foreign securities and I’m not a CPA or CFP. Investors concerned about tax consequences should seek advice from someone knowledgeable about their tax situation. Expense Ratio The ETF is posting .08% for an expense ratio, which is very low. Market to NAV The ETF is trading at a .45% premium to NAV currently. In my opinion, a .45% premium to NAV is a problem for new investors. I think the ETF is significantly less attractive when it trades above NAV. A .10% premium isn’t too bad in my opinion, but .45% bothers me. It’s not terrible, but I’d be cautious about that. Largest Holdings The diversification within the ETF is excellent, as shown by the following chart: (click to enlarge) I don’t love having my portfolio invested in U.S. Dollars (my checking account gives me that exposure), but I can understand the ETF needing to have some cash. With no company over 1.5%, that diversification is great. I have not performed individual research on the holdings, but with no exposure over 1.5%, I don’t think there is a viable case for returns on time in researching the individual holdings. Investing in the ETF is largely relying on modern portfolio theory. The argument for the investment is the respectably low correlation of the portfolio to the major U.S. index funds. Making an investment requires a belief that markets are at least somewhat efficient so that the companies within the portfolio will be reasonably priced. Conclusion I’m currently screening a large volume of ETFs for my own portfolio. I’ll do a little more digging on SCHF later and post what I find. The portfolio I’m building is through Schwab, so I’m able to trade SCHF with no commissions. I have a strong preference for researching ETFs that are free to trade in my account. I think SCHF will merit a fairly small position within that ETF portfolio. The low correlation and the low expense ratio are the driving factors for me. Additional disclosure: Information in this article represents the opinion of the analyst. All statements are represented as opinions, rather than facts, and should not be construed as advice to buy or sell a security. Ratings of “outperform” and “underperform” reflect the analyst’s estimation of a divergence between the market value for a security and the price that would be appropriate given the potential for risks and returns relative to other securities. The analyst does not know your particular objectives for returns or constraints upon investing. All investors are encouraged to do their own research before making any investment decision. Information is regularly obtained from Yahoo Finance, Google Finance, and SEC Database. If Yahoo, Google, or the SEC database contained faulty or old information it could be incorporated into my analysis. The analyst holds a diversified portfolio including mutual funds or index funds which may include a small long exposure to the stock. Scalper1 News
Scalper1 News