Tag Archives: alternative

A Red Flag On The S&P 500 Index
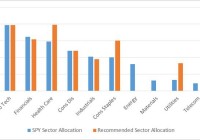
Summary The U.S. Economy is growing at an above trend pace over the last 2 quarters. Despite this there has been recent volatility in U.S. equity markets and there was a shift in sector performance. Nonetheless the trend in the S&P 500 remains intact with a 3 month outlook on the S&P 500 at 1170. A Red Flag On The S&P 500 I love the beach. Almost every weekend I would go on afternoons and take a swim. I would build sand castles and often times swim in the water and if I were hungry I would go by the local kiosk and eat some delicacies such as “Bake & Shark” or “pholouri”. Those were fun times. Even now when I get an opportunity I would spend some of my vacation days by the beach relaxing on the sand. But every time by the beach wasn’t always pristine. On some days there would have been rough waters or areas of roughness by the bay. The lifeguards would put up these red flags by the areas that were not safe for swimming. The red flags were a warning for swimmers so that drowning would be prevented. On the Friday 16th January 2015 close of the U.S. equity market, I observed a red flag on the S&P 500 Index. While the U.S. economy has been moving at an above trend pace over the past couple of quarters and the risk premium for investing in U.S. stocks are at 1-year lows, there has been a shift in sector performance, showing that the S&P 500 Index is becoming defensive. As such a new asset allocation is recommended. While still being overweight in U.S. equities by having a position in the SPDR S&P 500 Trust ETF (NYSEARCA: SPY ), a heavy overweight position in the health care sector is recommended, through the Health Care Select Sector SPDR Fund (NYSEARCA: XLV ). Slightly overweight positions are proposed in the Consumer Staples Select Sector SPDR ETF (NYSEARCA: XLP ) and the Utilities Select Sector SPDR ETF (NYSEARCA: XLU ) . Neutral positions should be observed in info tech through the Technology Select Sector SPDR ETF (NYSEARCA: XLK ) and the Consumer Discretionary Select Sector SPDR ETF (NYSEARCA: XLY ). Finally underweight positions in the energy sector through the Energy Select Sector SPDR ETF (NYSEARCA: XLE ), the materials sector through the Materials Select Sector SPDR Fund (NYSEARCA: XLB ) and telecoms through the SPDR S&P Telecom ETF (NYSEARCA: XTL ) are also recommended. The table below illustrates the recommendations. Chart 1 – Recommended Portfolio Allocation Versus S&P 500 Index as at Jan 9 th 2015 (click to enlarge) Source: Cerebro Recommendation using Microsoft Excel By looking at the allocation the portfolio is prepped for rough waters. On a weekly basis the portfolio metrics utilized to derive the portfolio allocation will be analyzed to determine whether another shift in asset allocation is required. Economic Activity Over the past couple of quarters the U.S. economy has been operating at an above trend pace. Latest figures show that U.S. GDP grew 2.7% year over year in the 3rd quarter of 2014, 0.4% higher when compared to the previous comparable quarter. U.S. GDP growth is also moving above its 4 quarter moving average of 2.6%. Chart 2 – U.S. GDP Growth (Y-o-Y %) as at Sept 2014 (click to enlarge) Source: Bloomberg The U.S. has been one of the leaders of growth from the developed economies and this trend is expected to continue, with its consumers obtaining a stronger purchasing power due to a strengthening U.S. Dollar. One of the more visible aspects of an appreciating U.S. Dollar was the decline in WTI Crude Oil. The over 50% decline in oil should bode well for the U.S. consumer. The uptrend in growth is also expected to continue as the slack in the U.S. labor market recedes. Chart 3 – U.S. Unemployment Rate (%) as at Dec 2014 (click to enlarge) Source: Bloomberg The U.S. unemployment rate stood at 5.6% at the end of the year, below the 12 month average of 6.2% and it is the lowest rate over the past 5 years. The “weather” in the U.S. appears to be just fine. Things appear to be going so well in the U.S. that the Fed ended its Q.E. program in October 2014. Also analysts expect the Fed to be raising its benchmark rate by the 3rd quarter of 2015. The Fed has continuously reiterated that it is data dependent and it will not make a move in rates unless the data corroborates the move. This is why the rate increase is expected 6 months ahead because the inflation data does not reflect a hike in rates. Over the month of November, U.S. CPI had the largest decline since December 2008. The retreat was attributed to the precipitous fall in fuel. U.S. CPI fell to 1.3% year-over-year in November 2014. The less volatile core CPI fell 0.1% year-over-year to 1.7%. Energy costs fell 3.8% versus a month earlier, led by a 6.6% decline in gasoline. While rent, medical care and airline fares rose, it was negated by the largest drop in clothing costs in 16 years and the largest fall in prices in used cars & trucks in September 2012. The declining energy & transportation costs will help both companies and consumers, improving the expectations for an increase in the S&P 500 Index in the short to medium term. Chart 4: 5-Year Chart of U.S. CPI (Y-o-Y %) as at Nov 2014 (click to enlarge) Source: Bloomberg Relative Asset Allocation & Sector Rotation Metrics By looking at the performance of bonds, stocks and commodities, a next move in the asset class performance of stocks can be forecasted as all these assets are related. Table 1: Total Returns of SPY, the iShares 7-10 Year Treasury Bond ETF (NYSEARCA: IEF ) & the PowerShares DB Commodity Index Tracking ETF (NYSEARCA: DBC ) ETFs Over Various Time Periods as at Jan 16 th 2015 Source: Bloomberg Chart 5: 6-Stage Business Cycle Source: StockCharts Based on the total returns of the ETFs above, the commodities are in a bear market while stocks and bonds are performing positively. Based on the above data it can be said that we are in stage 2 of the business cycle, with stocks and bond prices expected to continue to increase. Given that U.S. yields are expected to decline, stocks remain favored over bonds with the earnings yield of the S&P 500 at 5.58% as at January 16th 2015 while the U.S. 10-Year yield is at 1.84%. The difference between the 2 asset classes is 3.74%. On average, over the past year, the S&P 500 made a daily low when the difference or spread was 3.49%. Another point to note is that on average, over the past 12 months, the spread when the S&P 500 made a daily high was 3.09%. Thus one can deduce that the S&P 500 is closer to making a new low than a new high and that this low would be made soon (and perhaps around the 2040 to 2015 price zone). A daily price high can be deduced when the spread between the S&P 500 earnings yield and the U.S. 10 Year yield nears or is less than 3.09%. It can be construed that investors are not prepared to invest in U.S. equities as the risk premium (the value attained for buying such a risky asset as U.S. equities) for investing in U.S. equities heads below 3.09%. While the “weather” appears good, the waters are rough and it triggered a red flag. This red flag was derived from the shift in sector performance over the last couple of weeks. The tables below denote the shift. Table 2: S&P 500 Sector Total Returns Over Various Time Periods as at January 9 th 2015 Source: Bloomberg Table 3: S&P 500 Sector Total Returns Over Various Time Periods as at January 16 th 2015 Source: Bloomberg The health care, consumer staples and utilities all became leaders, indicating that the market is defensive, despite the S&P 500 Index having a larger than average risk premium. This move in sector performance complemented the move in the VIX, a measure of volatility for the S&P 500, which made a daily high of 23.34, which is below the 1 year October 2014 high of 31.06. Chart 6: Daily VIX Candlestick Chart as at 16 th Jan 2015 (click to enlarge) Source: Bloomberg Despite the shift in total returns of the sectors, when the returns are weighed versus the S&P 500, which smoothens the data, the shift is not so drastic. Chart 6: S&P 500 Sector Relative Rotation Graph as at January 16 th 2015 (click to enlarge) Source: Bloomberg From the relative rotation graph above we can see that info tech and health care are the leaders while telecom, materials & telecom are the laggards. Utilities & consumer staples are neutral with positive momentum while financials and consumer discretionary are also neutral, with negative momentum. By marrying the two concepts, total return sector performance & sector relative rotation, the recommended sector allocation in chart 1 was derived. Technical Analysis Based on the chart analysis as well as the risk premium in the S&P 500, support is seen around the 2040 to 2015 price region, with the S&P 500 expected to reach 1170 over the next 3 months. Chart 7: S&P Index 500 Candlestick Chart as at Jan 16 th 2015 (click to enlarge) Source: Bloomberg
How To Design A Market Neutral Portfolio – Part 2

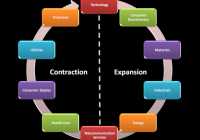
Summary Sector diversification is a key in market neutral investing. Two examples. Questions to solve for IRA compatibility. My previous article described the investor profile to hold a market neutral portfolio and some characteristics of this investing style illustrated by examples. I also explained why I prefer using an index ETF for the short side of the portfolio. In the next step, I want to focus on the benefit of sector diversification in market neutral investing. Sector diversification is especially important when the objective is to beat the benchmark in all market conditions, that is to say in all phases of the expansion-contraction cycle. The reality is more complicated than the figure. Cycles of different and variable periods may be in play, and macro trends can freeze the cycle for some sectors (like oil price does for energy and materials). In fact, it is sometimes quite difficult to figure out where we are and on which time frame when various cycles are combined. This is why, if an index ETF is on the short side, the long side of the portfolio must be diversified, not necessarily in all sectors, but at least in a few cyclical and defensive sectors. Since the return of such a Market Neutral Portfolio is the alpha of the long side, diversification in defensive and cyclical stocks is a key to keeping drawdowns acceptable in duration. In my opinion, the historical maximum duration in drawdown of an investing strategy is a parameter as important as the return and volatility. Examples I have performed a simulation of a portfolio mixing all the S&P 500 strategies of my book «The Lazy Fundamental Analyst» (Harriman House 2014). There are 9 strategies, one for each sector of the GICS classification, except Telecommunication (which is very small to elaborate statistical models). Each strategy selects 10 S&P 500 companies using a simple ranking process based on 2 fundamental factors. The factors are sector-dependent, chosen using historical statistics. The result is an equal-weighted portfolio of 90 stocks in a universe or 500, updated and rebalanced every 4 weeks. It is quite a big set (18% of the S&P 500 index) with various logics mixed, so the performance can hardly be suspected of being curve-fitted or random. Of course, past performance, real or simulated, is not a guarantee for future returns. But on such a portfolio it gives a good clue on the risk. The next chart shows the simulation of the 90-stock S&P 500 Lazy Portfolio (long side only) since 1999, with a 0.1% transaction cost and a 4-week rebalancing: (click to enlarge) The next table gives statistics of the excess return of the portfolio over the SPDR S&P 500 Trust ETF (NYSEARCA: SPY ) by 4-week periods, which corresponds to the market neutral portfolio with a leveraging factor 2, without the margin and carry cost for the “short half”. Average 4week return Average Annual return Max Drawdown Depth Max Drawdown Duration Avg gain / Avg loss 4week gain probability Kelly criterion Kelly crit. 95% confidence 0.94% 12.9% 20.5% 19 months 1.52 67% 0.46 0.35 Holding 90 stocks is a lot. In my real market neutral portfolio, I have reduced the number by: Excluding the most sensitive sectors to macroeconomic and geopolitical concerns: finance, energy and materials. My aim is not to get the best possible return, but a good return with a risk as low as possible. Optimizing the models to keep only 24 stocks with a diversification pattern, including at least 2 defensive sectors, 2 cyclical sectors and a minimum number of stocks in each of them. Optimizing to a lower number of stocks incurs a risk of curve fitting. However, with 24 holdings and various ranking logics, the risk remains quite low. The biggest danger of optimizing is not over-rating the possible return, but under-rating the real risk. In a diversified market neutral portfolio, the risk is limited by design. The next chart shows the simulation of my 24-stock portfolio (long side only) since 1999, with a 0.3% transaction cost and a 2-week rebalancing: (click to enlarge) This portfolio is more dynamic (rebalanced twice more often). It is also focused on large caps, but may hold a limited number of liquid small caps from the Russell 3000 index. Even if I use volume filters, I use a higher transaction cost to model a higher spread and slippage. The next table gives statistics of the excess return of the portfolio over SPY by 2-week periods, which corresponds to the market neutral portfolio leveraged twice, without the margin and carry cost. Average 2week return Average Annual return Max Drawdown Depth Max Drawdown Duration Avg gain/Avg loss 2week gain probability Kelly criterion Kelly crit. 95% confidence 0.79% 22% 11% 13 months 1.69 64.2% 0.43 0.36 These are examples. Ideas and steps can be reused with other quantitative models, or with a stock picking based on due diligence. The main idea here is to formalize and follow a sector-based diversification pattern. A next article will explain how to use leveraged ETFs to implement this strategy with a lower or no leverage (ProShares Ultra S&P 500 ETF (NYSEARCA: SSO ), ProShares UltraPro S&P 500 ETF (NYSEARCA: UPRO )), and the consequences of using inverse ETFs to avoid short selling (ProShares Short S&P 500 ETF (NYSEARCA: SH ), ProShares UltraShort S&P 500 ETF (NYSEARCA: SDS ), ProShares UltraPro Short S&P 500 ETF (NYSEARCA: SPXU )). Indeed market neutral investing can be implemented in an IRA account. Feel free to follow me if you don’t want to miss it. Data and charts: Portfolio123 Additional disclosure: Long SPXU as a hedge. Past performance is not a guarantee of future returns.

Aqua America: Far From Flashy But Providing Value For Shareholders

Summary Aqua America is a great stock to create balance in a portfolio that is too risk heavy . The company has an extremely high profit margin that outpaces those of competitors . A history of dividend increases and share buybacks provide increased value for shareholders . Targeted purchases in new markets help the company expand its customer base for future profitable returns. Lets admit it from the top, owning water utility stocks is not something that most people are going to brag about. Though they may not make for good party talk, they can in fact make for good returns. Aqua America (NYSE: WTR ) is one such stock that investors should consider adding to their portfolios. Balancing Out A Little Of The Risk The best way to think about Aqua America is as a risk balancing stock to add to one’s portfolio. The company certainly does not have an explosive growth future forecasted. As a matter of fact, consensus estimates have the company growing at less than five percent per year for at least the next five years. However, what Aqua America lacks in growth it more than makes up for in profit margin and dividend returns. Profits margins are important to water utility companies as they are a sign of how cost effectively they are delivering their product to the customers. Generally speaking, water and wastewater services are pretty straight forward. Once the infrastructure has been put in place, the company’s main responsibility is to ensure that everything remains running as it should. Aqua America has opened up a lead in profit margin over some of its main competitors. The following table demonstrates how they have an edge: Company Aqua America York Water Co (NASDAQ: YORW ) Connecticut Water SVC Inc. (NASDAQ: CTWS ) SJW Corp. (NYSE: SJW ) Profit Margin 28.63% 23.46% 21.96% 15.99% Aqua America has proven time and time again that it can deliver at a cost that is low. They have maintained strong profit margins, and this has helped them to consistently beat their earnings expectations. Dividend Increases And Stock Splits Galore Aqua America simply delivers when it comes to creating value for shareholders. While shareholders of some other companies wait around patiently for years to get news of a dividend offering, Aqua America shareholders can practically expect one every year. The company has literally delivered a dividend hike twenty-three times in the last twenty-two years according to this press release . In late 2013, following a stock split, the dividend went from $0.19 per share quarterly to $0.152 per share quarterly to match the split. However, by August of 2014 the company was paying $0.165 per share quarterly and hinting that it may raise the dividend again in the future. Aqua America delivers for their shareholders in another way as well. In just the last nineteen years, the company has had seven stock splits, the most recent being a 5 for 4 split that took place in September of 2013. This kind of activity may be mostly psychological for shareholders, but it sure does get people talking. Adding more shares to the company means that there must be a good amount of outside interest in purchasing those shares. Aqua America Likes To Purchase Back Shares Of Itself The company is not afraid to show confidence in its own stock. They show this by creating share buyback programs. They had just approved a plan to purchase back approximately 685,000 shares in 2014. Of that, the company has so far purchased back 560,000 and will finish up the rest this year. However, before they could even finish up this buyback program they announced another one. As soon as the first one is finished, they are going to start a repurchase program with the goal of buying back one million more shares. When a company is showing this much confidence in itself it is certainly worth taking note. Current shareholders are seeing the value of their shares increase as a result of the company purchasing back some shares for itself, and they have to be happy about this. The fact that the company is practically tripping over itself to buy back more and more shares is certainly very promising. However, this is not the only thing that Aqua America has been purchasing lately. New Assets In Ohio And North Carolina Expand Aqua America’s Reach The Pennsylvania based Aqua America does not just serve customers in that state. They actually have their hand in eight different states including Ohio and North Carolina. In these two states they just finished purchasing up some water systems to expand their reach deeper into the states. BusinessWire reports on these small but targeted purchases by saying this: Aqua Ohio purchased the assets of the Lake Mohawk and Lake Tomahawk water utilities that serve approximately 3,100 people in Northeastern Ohio for $1.76 million. And, Aqua North Carolina acquired the water system assets of the Honeycutt Water systems for $75,000. The systems serve about 260 people in the Glennburn, Knollwood and Wimbledon developments in Gaston County. Aqua will operate the systems from its western regional office in Denver, North Carolina. Aqua North Carolina serves more than 250,000 people in 51 counties statewide. As you can see, these were not wildly expensive purchases. They did not have to be. They were simply targeted acquisitions of new batches of customers in states that the company already operates in. They spend a little money right now and lock in a whole new crop of customers that they can rely on for years to come. Best of all, the company is not having to extend itself by expanding into states that it does not already exist in. These various factors make Aqua America a best of breed among water utility companies. It is a slow growth company that can help balance out a portfolio and provide more consistent and steady returns for the long term.