Tag Archives: alternative

Adaptive Asset Allocation: Which Day Of The Month Is Best To Trade?
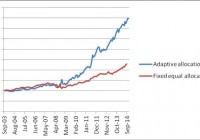
Summary The performance of adaptive asset allocation is sensitive to the day of the month when transactions are executed. The performance is better if the trades are executed around the end/beginning of the month than close to the middle of the month. The day of month effect is consistent for ETFs and related mutual funds. We obtained similar effects on (SPY, TLT), (VTI, AGG), (FSTMX, FTBFX), and (VTSMX, VBMFX) pairs. In a couple of recent articles , we demonstrated that a very simple and well-diversified portfolio may be made up of two instruments, one representing the total stock market and the other the total bond market. These portfolios are quite robust and achieve decent returns using simple strategies such as rebalancing and momentum-based adaptive allocation. At the suggestion of some readers, we investigate the effect of the day of month on the performance of the momentum-based adaptive asset allocation strategy. From many possibilities, I selected the following four portfolios: one built with SPY and TLT, the second with iShares and Vanguard ETFs, the third with Vanguard mutual funds, and the fourth with Fidelity mutual funds. ETFs portfolio: iShares 20+ Year Treasury Bond ETF (NYSEARCA: TLT ) and SPDR S&P 500 Trust ETF (NYSEARCA: SPY ). ETFs portfolio: iShares Core Total US Bond Market ETF (NYSEARCA: AGG ) and Vanguard Total Stock Market ETF (NYSEARCA: VTI ). Mutual funds portfolio: Vanguard Total Bond Market Index Fund (MUTF: VBMFX ) and Vanguard Total Stock Market Index Fund (MUTF: VTSMX ). Mutual funds portfolio: Fidelity Total Bond Market Index Fund (MUTF: FTBFX ) and Fidelity Spartan Total Stock Market Index Fund (MUTF: FSTMX ). For purposes of comparison, we simulate these portfolios from December 2003 to December 2014, a total of eleven years. The time period of the study was selected based on the availability of historical data of the investment instruments; AGG was created in September 2003. The data for the study were downloaded from Yahoo Finance on the Historical Prices menu for the eight tickers, SPY, TLT, AGG, VTI , VBMFX , VTSTX , FTBFX and FSTMX. We use the monthly price data from September 2003 to December 2014, adjusted for stock splits and dividend payments. The article has two parts. In the first part, we present general results for the four portfolios. The second part presents the effect of varying the day of the month when the trading is done. Part I. General Results The first study was done on the SPY + TLT. In it, we compare the results obtained with the following two strategies: (1) A portfolio with 50% SPY and 50% TLT without rebalancing. This portfolio is called “fixed allocation”. (2) A portfolio that is, at all times, invested 100% in either SPY or TLT. The switching, if necessary, is done monthly at the closing of the last trading day of the month. All the funds are invested in the instrument with the highest return over the previous 3 months. This portfolio is called “adaptive allocation”. The data below shows the investment results over 11 years (132 months). The first line is a buy-and-hold on SPY, the second is a buy-and-hold on TLT, the third is buy-and-hold of an initial investment of 50% in SPY and 50% in TLT, while the fourth line is adaptive allocation on SPY and TLT based on a look back of 3 months. Table 1. SPY + TLT portfolios January 2004-December 2014 Total Return% CAGR% Max DD% SPY 130.4 7.88 -50.79 TLT 126.6 7.72 -21.81 Fixed Allocation 128.5 7.76 -18.68 Adaptive Allocation 347.0 14.58 -17.13 The equity curves for the fixed and adaptive allocation of the SPY + TLT portfolios are shown in Figure 1. (click to enlarge) Figure 1. Equities of SPY + TLT portfolios Source: This chart is based on EXCEL calculations using the adjusted monthly closing share prices of securities. The second study compares the four pairs using the momentum-based adaptive allocation. The trading is done at the month’s closing prices. The results are given in Table 2. Table 2. Adaptive allocation of four portfolios January 2004-December 2014 Total Return% CAGR% Max DD% SPY + TLT 347.0 14.58 -17.13 VTI + AGG 241.6 11.82 -13.03 VTSMX + VBMFX 243.4 11.87 -13.81 FSTMX + FTBFX 214.8 10.99 -20.29 The equity curves for the three portfolios with adaptive allocation are shown in Figure 2. The Vanguard mutual fund was omitted because it virtually overlaps with the Vanguard ETF portfolio. (click to enlarge) Figure 2. Equities of portfolios with adaptive allocation Source: This chart is based on EXCEL calculations using the adjusted monthly closing share prices of securities. Part II. Day of Month Trading Results The study was done using the daily historical prices of the eight instruments. Because the results were very similar for the four pairs, we report mostly the results for the SPY + TLT pair only. The switching between bond and stock funds was done, if necessary, on the same day of the month. The look back period was three months, comparing prices on the same day of the month, but for three months apart. The day of the month is indicated by a variable called “shift”. Shift takes values between -16 and 6. Here shift=6 means the 6th trading day of the month, shift=0 means the last trading day of the month, shift=-1 means the trading day before the last trading day, etc. The equity curves for the SPY + TLT portfolio for three different trading days and with adaptive allocation are shown in Figure 3. As can be seen, the trading day of the month has a significant effect on the results. Trading on the last day of the month is better than trading on the 6th day of the month, but a little worse than trading seven days before the end of the month. These results are related to the specific historical data and cannot be generalized. (click to enlarge) Figure 3. Equities of the SPY + TLT portfolios with adaptive allocation Source: This chart is based on EXCEL calculations using the adjusted daily closing share prices of securities. To illustrate better the variability of the performance of adaptive allocation with the trading day of the month, we show the scatter plots of CAGR and DD versus the shift values from -16 to 6. (click to enlarge) Figure 4. CAGR% of the SPY + TLT portfolios with adaptive allocation Source: This chart is based on EXCEL calculations using the adjusted daily closing share prices of securities. As can be seen in Figure 4, CAGR varies very little for shift values from -5 to 5, but decreases substantially for shift values outside this range. (click to enlarge) Figure 5. DD% of the SPY + TLT portfolios with adaptive allocation Source: This chart is based on EXCEL calculations using the adjusted daily closing share prices of securities. As can be seen in Figure 5, DD varies very little for shift values from -16 to 4, but increases somewhat for shift=6. Conclusions The day of the month when the trading is done affects the performance obtained applying the adaptive asset allocation strategy. The performance is better if the trades are executed around the end/beginning of the month, than close to the middle of the month. The day of month effect is consistent for ETFs and related mutual funds. It may be useful to extend this study to various portfolios with instruments from other asset classes.

Is It Too Late To Buy Exelon?

While returning 41.9% total return over the previous 12 months, EXC has a bit more juice in its gas tank. Fundamental business changes have reduced earnings volatility. Gains in profitability are dependent on improving power markets. PJM is so afraid of a lack of generating capacity it has proposed a premium for reliability. While Exelon (NYSE: EXC ) had generated total returns of 41.9% over the previous 12 months, vs 21.2% for the Morningstar Diversified Utilities Index and 11.6% for the S&P 500, there may still be a bit of juice left in its gas tank. However, just do not look at 1-year and 3-year returns as it may make you sick at a puny 1.6% and an even worse -1.2%, vs. 12.6% and 10.5%, respectively, for Diversified Utilities and 18.4% and 14.2%, respectively, for the S&P. Driving EXC higher will be fundamental business strategy changes that is expected to increase earnings from $2.40 in 2014 to $2.51 in 2015 and $2.66 in 2016. The changes include the transformation from 20% regulated revenue (Exelon Utilities segment) and 80% unregulated revenue from merchant power (Exelon Generation segment) in 2008 to around 61% regulated and 39% merchant power by the end of 2017. Profitability in its regulated utility segment should improve over the next few years. Illinois enacted an annual rate evaluation in 2011 that is being phased in and should improve the profit uncertainty of Exelon subsidiary ComEd. 2014 ROE for ComEd is estimated at 8% to 9% vs a target of 9.0% (30-yr Treasury + 5.8%). PECO’s 2014 ROE is expected to be 11% to 12% vs a target of 10% and BGE’s 2014 ROE is expected to be 7% to 8% vs a target also of 10%. ComEd has annual rate reviews using the above formula. PECO is looking for a rate increase to be filed either this year or next and BGE anticipates requesting a rate increase this year and will be its first since 1999. In addition to the above ROE, EXC’s regulated rate base is expected to expand over the next few years. For example, ComEd is expected to grow its rate base from $9.6 billion in 2014 to $12.6 billion in 2017. PECO will increase its rate base from $5.6 billion to $6.3 billion and BGE is expected to expand its rate base from $4.9 billion to $5.8 billion over the same time frame. Combined, EXC is expecting to increase its regulated asset base from $20.1 billion to $24.7 billion over the next three years and would represent 7.8% annual growth. Management believes these regulated utilities can generate 8% to 10% annual EPS growth over the next three years. EXC is in the process of acquiring the regulatory approval to complete its merger with PEPCO (NYSE: POM ). This expansion will not only fill in the geography of its service territory but offers future profit potential as well. Below is a map from EXC’s latest investor presentation outlining the combined service territory after the merger. PEPCO includes Potomac Electric with 800,000 customers, Atlantic City Electric with 545,000 customers and Delmarva Power and Light with 632,000 customers. Source: Exelon investor presentation. An interesting aspect of the acquisition will be EXC management’s ability to improve profitability at PEPCO. Each operating unit has underperformed its allowed ROE, and some by a substantial amount. Below are the 2013 results for earned ROE and allowed ROE, by business: PEPCO MD earned ROE of 7.5% out of an allowed 9.4% PEPCO DC earned ROE of 6.7% out of an allowed 9.5% Delmarva DE Electric earned ROE of 8.8% out of an allowed 9.8% Delmarva DE Gas earned ROE of 8.6% out of an allowed 9.8% Delmarva MD earned ROE of 8.0% out of an allowed 9.8% Atlantic City Electric earned ROE of 4.9% out an allowed 9.8% Management believes regulated utilities can earn $1.25 to $1.55 per share in 2017, sufficient to cover its annual dividend. The balance of EXC’s business is providing merchant power. Of its 32 GW capacity, 60% is power by nuclear, 25% by natural gas, 7% each from hydro and oil, and the remaining 3% from wind and solar. The majority of their generating capacity is located in the PJM controlled Mid-Atlantic and eastern Midwest, but has a growing generating base in Texas. As a merchant power producer, EXC has historically offered substantially higher exposure and risk to the volatility of commodity power markets. As the nation’s largest nuclear power generator, EXC is one of the lowest-cost providers of reliable, base load electricity. Industry peer Southern Company (NYSE: SO ), a major electricity provider in the Southeast, provides its merchant power customers based on a long-term Purchase Power Agreement PPA that could extend over 20 years. EXC, on the other hand, relies on the regional PJM-managed three-year rolling contracts, making pricing more susceptible to the whims of the commodity power market. It is important for investors to appreciate this fundamental difference as it influences both revenue and profitability. Below is the Front Year Price graph on electricity pricing for the PJM Western Hub dating back to 2001, as offered by sriverconsulting.com (pdf), a segment of EnerNOC (NASDAQ: ENOC ). The graph is the average of the front 12 months NYMEX future contracts for PJM West-Hub Electric trading on that date. Example: The front-year on July 15, 2008, was the average of the July 2008 to June 2009 contracts, which was $104.35/MW. (click to enlarge) Source: South River Consulting. Notice the collapse from $120 in June 2008 to a bottom of $40 in February 2012. Since 2009, pricing has been stuck in the $40 to $60 range. The spike in January 2014 was the result of very low generating reserve capacity during the polar vortex cold spell in the Northeast. Below is a graph of EXC’s 15-year return on invested capital ROIC: (click to enlarge) Source: F.A.S.T.graphs.com. The correlation between PJM pricing and ROIC is obvious in these two graphs. It is not a coincidence profits and stock prices also peaked at the same time — in 2008. The growth of EXC will be reliant on a recovery of electricity pricing in the Mid-Atlantic and Northeast. The sharp price spike in 2014 is indicative of the severe supply dislocation experienced during the cold snap. Not only was natural gas generating plants curtailed due to a lack of pipeline capacity but equipment seized up in the cold. Coal piles were frozen, making it difficult to feed the plant. Combined, an unsustainable 22% of available generating capacity was offline. Considering the possibility of another vortex-like event, PJM stated , a comparable rate of generator outages in the winter of 2015/2016, coupled with extremely cold temperatures and expected coal retirements, would likely prevent PJM from meeting its peak load requirements. In a letter (pdf) to the House Energy Subcommittee concerning the power situation in the Northeast, PJM’s Craig Glazer, VP-Federal Government Policy, wrote: Because less-expensive coal generation is retiring and in part is being replaced by demand-response or other potential high energy cost resources, excess generation will narrow and energy prices could become more volatile due to the increasing reliance on natural gas for electricity generation. “Would likely prevent PJM from meeting its peak load requirements” is a nice way of saying brownouts or blackouts. “Energy prices could become more volatile” is also code for higher prices. The lack of power reserves and the spike in prices spooked the PJM to alter its auction process and to offer a price premium to power generators who would guarantee reliability regardless of the weather. Nuclear power generation is considered the most reliably by the PJM, and EXC’s plants qualify for the premium. The premium could add $0.17 to $0.25 to earnings per share. More information is available from the article “Exelon: Nuke Reliability Worth An Additional $5 A Share,” published last October. There is also concern the Northeast is facing a shortage of generating capacity due to the ongoing closing of coal plants and the December 2014 shuttering of the Vermont Yankee nuclear plant. According to EXC’s presentation, about 20MW of generating capacity is expected to be closed in the Northeast between 2012 and 2016, with half that capacity closing this year. Many blindly claim adding to intermittent load solar- and wind-generating capacity or building new natural gas generating facilities will offset closed base-load coal and nuclear generating capacity. However, the reality is intermittent-load is a poor replacement choice for base-load and due to pipeline constraints there is a potential shortage of natural gas in the Northeast, as demonstrated during the winter of 2014. Even the grid manager in the Northeast acknowledges the conundrum of available power and pipeline constraints. The report “ISO New England 2014 Regional Electricity Outlook” states: The capacity that will replace New England’s retiring generators is likely to be a combination of renewable and gas-fired resources. However, the relationship between renewables and the conventional resources needed to ensure grid reliability presents a puzzle: more wind and solar power creates a need for fast-starting, flexible resources that can take up the slack when the wind stops or the clouds roll in. New natural gas generators will likely fill this role, with their relative ease of siting and typically lower fuel costs-but this will further strain natural gas pipeline capacity. Most new pipelines to the gas-starved Northeast would traverse the State of New York, which recently banned fracking. For example, the Constitution Pipeline from the Marcellus to the Northeast has received FERC approval but awaits State environmental approvals. The opposition to the pipeline through N.Y. could delay the project. The region currently has five major pipeline systems and seven new projects have been proposed. However, several of them have stalled because of ferocious opposition. From two NY Times articles here and here : A year ago, the governors of the six New England states agreed to pursue a coordinated regional strategy, including more pipelines and at least one major transmission line for hydropower. The plan called for electricity customers in all six states to subsidize the projects, on the theory that they would make up that money in lower utility bills. However, in August, the Massachusetts Legislature rejected the plan, saying in part that cheap energy would flood the market and thwart attempts to advance wind and solar projects. That halted the whole effort. According to National Grid (NYSE: NGG ), the gas and electric utility for a majority of the Northeast, the lack of natural gas generating capacity and the lack of pipeline capacity is a contributing factor in higher electricity rates. Connecticut’s rate of 19.74 cents per kilowatt-hour for September was the highest in the continental United States and twice that of energy-rich states like West Virginia and Louisiana. The lowest rate, 8.95 cents, was in Washington State, where the Columbia River is the nation’s largest producer of hydropower. For the coming winter, National Grid, the largest utility in Massachusetts, expects prices to rise to 24.24 cents, a record high. The average customer will pay $121.20 a month, a 37 percent increase from $88.25 last winter. The lack of electric generating capacity is and will continue driving up the price for electricity, which will positively affect EXC. Based on beta and yield, EXC is current valued in line with other large-cap electric utilities. EXC has a beta of 0.50 vs. an average of 0.54 and offers a yield of 3.3% vs. an average of 3.3%. However, EXC is trading at a P/E of 15 vs. an average of 19, or a 20% discount based on its P/E ratio. In addition, while the average electric utility is expected to grow earnings by 4% to 6% annually, EXC could far exceed this rate based on higher pricing of its merchant power. Returning to ROIC, EXC has historically far surpassed its peers in generating returns based on their total capital structure. This is a direct result of their exposure to commodity power pricing. As the company has turned to a more regulated profile, their historic double digit ROIC has understandably declined. With higher profitability in their merchant power segment, investors should expect to see ROIC increase to the high single digit range of 8% to 9%. This level of ROIC will still be on the higher end of their peers. Morningstar offers their unique analysis on EXC: Bulls Say: Low-cost nuclear power plants run year-round and generate large profits even with currently depressed power prices. Exelon benefits more than any other utility from rising coal and natural gas prices, higher electricity demand, and environmental regulations on fossil fuel power plants. If gas and power prices remain low for many years, the Constellation acquisition in 2012 could prove prescient. Bears Say: Exelon’s performance depends on volatile power prices that fluctuate based on natural gas prices, coal prices, and regional electricity demand. Acquiring Constellation’s no-moat retail business and narrow-moat distribution utility in 2012 diluted Exelon’s wide moat. Many of Exelon’s growth projects come with regulated or contracted returns, reducing shareholders’ leverage to a rebound in power markets. It should be noted last week Morningstar downgraded EXC from “4 stars” to “3 stars,”, which is considered as neutral. The most likely reasons in the recent run-up in share prices. While not as cheap as a year ago when I penned the article “Exelon: Selling At 10-Year Lows” (or the four subsequent articles) suggesting investors buy in the $28 range, EXC still offers an 11% to 18% potential capital gain based on a 2-year target price between $42 and $45. Adding a 3.3% yield would generate annual returns of 7% to 10%. While not a barn-burner, this total return should be adequate for utility investors. Author’s Note: Please review full disclosure on author’s profile page.

Arctic Cold Brought Up UNG – For A Short Time

Summary Colder-than-normal weather brought up the price of UNG. EIA still estimates this year’s natural gas price to remain lower than last year’s. This week’s extraction from storage is estimated to be higher than the 5-year average. The recent news of possible Arctic weather in the coming week pushed up back up the price of United States Natural Gas (NYSEARCA: UNG ) to pass $16 at one point. Since then, however, its price resumed its descent. The price of UNG ended last week at $15.69 – representing a 4.6% gain, week over week. Despite the recent rally in UNG, it’s still 16% down in the past month. The cold snap drove up the U.S. consumption by nearly 7%, week over week. Most of this gain was in the residential/commercial sectors. Despite the low prices of natural gas, the U.S. natural gas output is still up by roughly 10% for the year. If prices were to remain low, however, this could eventually curb down the growth rate in the natural gas output in the coming quarters. But the main issue revolves around the potential changes in the demand for natural gas mainly in the residential/commercial sectors. Over the next couple of weeks, the temperatures mainly in the Northeast and Midwest are projected to be lower than normal. In the west coast temperatures are expected to be higher than normal. Conversely, this week, the current outlook for the heating degrees days shows lower than normal levels. Nonetheless, it seems that the low temperatures are likely to keep driving up the demand for natural gas for heating purposes. Let’s turn to the latest from the natural gas storage. Last week’s Energy Information Administration update showed a 236 Bcf extraction from storage – this was 46 Bcf higher than the 5-year average. But it was also 51 Bcf below last year’s extraction. Source: EIA This week’s extraction from storage is likely to be, again, higher than the 5-year average. Keep in mind, last week’s deviation from normal temperatures was, on average, -4.29. The lower-than-normal temperatures may result in higher than normal withdrawal. Even though the changes in storage provide an indication for the changes in the demand and supply for natural gas on a weekly scale, as I pointed out in the past, the relation between the prices changes in UNG and shifts in storage tend to have a low correlation. This is mostly on a week-to-week examination. On broader scale, however, lower extractions from storage tend to keep UNG down and vice versa. Looking forward, if the extractions from storage were to remain roughly 10% lower than the 5-year average, this could bring the natural gas storage in line with the 5-year average by the time the injection season commences. This is shown in the chart below. Source: EIA The EIA also estimates that the natural gas inventories will be roughly in line with the 5-year average by the end of March 2015. On a yearly scale, the EIA still expects natural gas prices to remain low in 2015 – the annual average price is estimated at $3.44; this is roughly 22% lower than the average yearly price in 2014. The uncertainty in the weather forecasts in the next couple of weeks could lead to big swings in the price of UNG – as was the case in recent weeks. Nonetheless, if temperatures don’t fall below current estimates, this could result in UNG resuming its descent. For more see: Has the Weakness in Oil Fueled the Decline of UNG?