Tag Archives: alternative

Stock Traders Flock Back To Gold ETFs
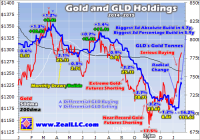
American stock investors and speculators started pouring capital back into gold this week in a serious way, aggressively buying GLD ETF shares. This buying was so massive that GLD had to shunt enough stock capital into physical gold bullion to grow its holdings by their fastest pace in about 5 years. And this is likely just the beginning, as American stock investors remain woefully underinvested in gold and not prudently diversified. Gold surged this week on massive buying from stock investors and speculators. This critical group of traders and their vast pools of capital utterly abandoned gold in the past couple years. So to see them start to flock back is a watershed event, heralding a major reversal in gold’s fortunes. And with their gold exposure remaining near extreme lows, they have vast buying left to do to restore prudent portfolio diversification. Successful investors have always practiced this essential concept of not putting all their eggs in one basket. This great wisdom is ancient, stretching back at least three millennia to King Solomon’s reign in ancient Israel. In the Biblical book of Ecclesiastes he advised, “Invest in seven ventures, yes, in eight; you do not know what disaster may come upon the land.” Portfolio diversification is absolutely critical. Most investors today keep the vast majority of their capital in stocks and bonds, which is fine. But truly wise ones also diversify into alternative investments , which simply mean not stocks, bonds, or cash. Gold has always been the leading alternative asset, largely thanks to its strong negative correlation with the stock markets. Gold thrives when stocks are weak, making it indispensable to managing overall portfolio risk. American stock investors’ preferred vehicle for diversifying into gold is the flagship SPDR Gold Trust ETF (NYSEARCA: GLD ). This is the world’s largest gold ETF by far, and offers some great advantages to stock traders. They can instantly buy or sell GLD shares, gaining or shedding gold exposure, with normal stock-trading accounts. And this is very efficient, with very low transaction costs. GLD’s mission is to track the gold price, which it has done flawlessly since its birth in November 2004. Investors and speculators owning GLD shares get gold-price exposure that’s virtually identical to gold’s underlying price moves. Achieving this mirroring isn’t trivial for GLD’s custodians, because the real-time supply and demand of GLD shares rarely matches gold’s own. That requires GLD to act as a conduit . When stock traders buy GLD shares faster than gold itself is being bought, they threaten to decouple to the upside. That would cause GLD to fail its tracking mission. So its custodians quickly step into the markets to offset that excess demand. They issue enough new GLD shares to supply that differential demand, and then use the proceeds to buy physical gold bullion that is held in trust for shareholders. Thus GLD is effectively a capital pipeline directly linking the vast pools of stock-market capital to gold. Differential buying pressure on GLD shares is quickly equalized into the underlying global physical gold market. So the more capital stock investors and speculators choose to deploy into GLD shares, the faster the gold price rises. GLD shunts stock-market capital into and out of gold, a double-edged sword. When stock traders sell GLD shares faster than gold itself is being sold, this ETF’s price will decouple to the downside. GLD’s custodians must quickly absorb that excess share supply, so they buy back enough shares to maintain gold tracking. They raise the capital necessary to make these purchases by selling some of the physical gold bullion held in trust for shareholders. Stock capital sloshes back out of gold. Even though the world’s gold miners launched this flagship gold ETF via their World Gold Council to increase gold investment demand, conspiracy theorists have long attacked it. So GLD has always been super-transparent. Every single day, it publishes its total gold-bullion holdings itemized down to the individual-gold-bar level including refiners, serial numbers, and weights. This week this list was 1,164 pages long! Watching GLD’s daily physical-gold-bullion holdings data is exceedingly important for all gold investors and speculators. It effectively shows stock-market capital flows into and out of gold itself. When GLD’s holdings are rising, stock-market capital is migrating into gold. When they are falling, it is exiting out. And this week an extraordinary reversal happened likely heralding a major sea change in gold investment. This first chart looks at GLD’s gold-bullion holdings over the past year or so in blue, measured in metric tons. They are superimposed over the gold price rendered in red. Stock investors and speculators just flooded back into gold through incredible differential GLD-share buying in recent days. I’ve carefully studied and watched GLD’s holdings for over a decade now, and I’m just amazed by this serious buying. Last Thursday January 15th, stock traders bought enough excess GLD shares to force its custodians to buy 9.6 tonnes of gold bullion. That grew GLD’s holdings by 1.4% that day, its biggest daily build since August 2011 just before the last major gold peak near $1,900! Stock investors flooded back into gold via GLD shares as gold soared 2.4% following Switzerland’s central bank greatly shocking the world’s markets. The Swiss National Bank suddenly and surprisingly abandoned its efforts to cap the Swiss franc in euro terms. This campaign was launched in September 2011 in response to the Eurozone financial crisis. It was intended to protect Switzerland’s export-heavy economy, keeping products affordable for its dominant Eurozone customers. SNB officials constantly called that cap the cornerstone of their bank’s policy. So traders weren’t ready for the SNB to capitulate out of the blue, it was a black-swan currency event sending shock waves cascading through global markets. Gold caught a major safe-haven bid in Europe on the resulting chaos, and American stock traders piled on. They were way underexposed to gold after years of shunning it, and their heavy differential buying of GLD shares certainly helped propel gold higher. Strong rallies feed on themselves, as nothing begets more buying like fast-rising prices. Stock traders snatched up GLD shares at such a furious pace that its holdings surged 13.7t or 1.9% on Friday the 16th and another 11.4t or 1.6% on Tuesday the 20th. All together over that 3-trading-day span, enough stock-market capital poured into gold via the GLD conduit to catapult this ETF’s holdings up 34.7t or 4.9%! This GLD holdings surge is readily evident above, a radical change from the heavy differential selling pressure GLD shares suffered in late 2014. I couldn’t remember the last time GLD’s holdings rocketed up so fast, so I had to crunch some numbers. This recent buying spree turns out to be GLD’s biggest 3-day build in both absolute and percentage terms in many years, a truly extraordinary buying event. GLD’s holdings hadn’t shot up by 34.7t in 3 trading days since May 2010, 4.7 years ago. That was an interesting time as stock traders migrating back into gold via GLD would help drive the yellow metal a whopping 56.3% higher over the next 15 months. Major stock-market capital returning to gold was a very bullish omen . This was also true the last time GLD saw a 4.9% 3-day percentage build in February 2009. That was 5.9 years ago, right after that once-in-a-century stock panic in late 2008 sucked in gold due to the resulting record U.S. dollar rally . But the subsequent big GLD-share differential buying comparable to last week’s heralded the early months of a major new gold up-leg. Over the next 2.5 years the gold price would rocket 92.4% higher as investors returned! So stock traders flooding into GLD is a major buy signal . As of this Wednesday, the data cutoff for this essay, GLD’s holdings were up 31.4 metric tons or 4.4% so far in January. This is serious buying by any standard. The chart above details GLD’s absolute and percentage holdings builds and draws on a monthly basis since early 2013. And the previous best month over this past year is merely July’s 11.1t or 1.4%. GLD’s January-to-date build nearly triples that! Though I was a few months early thanks to the Fed’s extreme financial-market distortions, I had been expecting stock investors to start returning to gold via GLD in a major way. They had totally abandoned gold in 2013 and 2014 as the Fed’s third quantitative-easing debt-monetization campaign had artificially levitated the stock markets. With stocks doing nothing but rally, demand for alternative investments collapsed. But stock markets are forever cyclical and can’t climb forever, no matter how much paper money the world’s central banks choose to print. So stretched to lofty and very-overvalued levels, it was only a matter of time until they inevitably reversed. And once that got underway, investors would remember the ancient wisdom of prudent portfolio diversification and start rebuilding their extraordinarily-low gold exposure. GLD’s holdings slumped to a miserable 6.3-year low of 704.8t earlier this month. At the prevailing gold price of $1,213, they were worth about $27.5b. Meanwhile, the 500 elite stocks of the S&P 500 had a collective market capitalization near $18,881.7b. Stock investors’ gold exposure can be approximated by comparing their capital invested in GLD shares to their capital invested in the leading S&P 500 stocks. That equates to mainstream stock-investor exposure to gold via GLD of just 0.15%! That is incredibly low by all historical standards. Many of the world’s best battle-hardened investment advisors believe that every investor should always have 5% to 10% of their capital deployed in gold. This is a prudent portfolio-diversifying hedge, an insurance policy that will pay out big when the stock markets decisively roll over. Merely to hit 5%, stock investors would have to up their GLD holdings by a staggering 34.3x! That’s not going to happen, but it illustrates just how chronically underinvested in gold stock investors are today. There is a more conservative read on at least how much stock capital will almost certainly flow back into GLD over the next couple years or so. This comes from just a few years ago when gold’s price last peaked. Back in August 2011 gold surged to $1,894 the last time it was in favor. That was inarguably the time gold enjoyed the most popularity among mainstream investors during GLD’s lifespan. That day GLD’s gold bullion held in trust for its shareholders was worth $78.2b, or 2.8x higher than today’s levels. But with the S&P 500’s market cap only at $10,585.3b then, stock investors’ gold exposure was around 0.74%. While that was a far cry from a basic 5% portfolio allocation in gold, it was still 5.1x higher than stock investors’ gold exposure today. So it’s not a stretch at all to expect stock investors’ gold exposure to gradually return to those gold-in-favor levels in the coming years. Gold will slowly regain popularity as these Fed-goosed stock markets inevitably roll over and lapse into their overdue cyclical bear market. Stock investors will remember the wisdom of prudent portfolio diversification to protect themselves from stock downturns. And no alternative investment is better for this critical mission than gold, thanks to its strong inverse correlation to the general stock markets. The recent serious differential GLD-share buying by stock investors is likely only the start, as they remain chronically underinvested in the yellow metal. This last chart illustrates how much differential GLD buying is still left to go. It extends GLD’s holdings and the gold price back to early 2013, when the Fed’s QE3 campaign and associated jawboning started levitating the U.S. stock markets. As alternative investments fell out of favor, the differential selling that hammered GLD shares was epic. The quarterly draws and builds in GLD’s holdings are shown here. This past week’s serious differential GLD-share buying by stock investors was a radical change, even at this scale. But GLD’s holdings have a long ways left to go to mean revert out of recent years’ extreme selling. Interestingly just days before the Fed more than doubled QE3’s debt monetizations to include U.S. Treasuries in December 2012, GLD’s holdings were at an all-time record high of 1353.3 metric tons. And that certainly wasn’t some anomalous extreme. Back 2.4 years earlier in the summer of 2010, they had hit 1320.4t. They averaged 1238.2t in 2011 and 1294.2t in 2012, and gold was actually suffering a major correction and consolidation throughout most of that span so it certainly wasn’t in favor among investors. So there’s no reason at all not to expect GLD’s holdings to fully mean revert back to those levels. Even after this week’s stunning surge of stock-market capital flowing into gold via GLD shares, this ETF’s holdings still have to climb another 553.8t to regain 2012’s average levels. That’s a staggering amount of marginal gold investment demand, and if it happens within a year or two it will help catapult the gold price dramatically higher. 2013’s epic outlying record plunge in GLD’s holdings puts this into perspective. That year as the Fed seduced stock investors into abandoning portfolio diversification, GLD’s holdings plummeted 552.6t. Nearly half of this extreme selling happened in 2013’s second quarter, which saw gold’s worst quarterly loss in an astounding 93 years! Those massive GLD gold-bullion liquidations that year driven by extreme differential selling helped batter gold down 27.9% in 2013. Imagine that all reversing. If stock investors merely migrate enough capital back into gold through the GLD conduit to regain those 2012 average GLD-holdings levels, gold is going far higher. Its price actually averaged $1,669 that year before 2013’s extreme selling. And with 2012’s correcting and consolidating, those gold levels were certainly nothing special and this metal wasn’t popular among investors. Such levels should easily return. Financial markets are forever cyclical , no trend lasts forever. No matter what money-printing mischief central banks are up to, stock bulls aren’t perpetual. They always eventually yield to subsequent bears. And just as stock markets can’t rise forever, gold can’t fall forever. Major reversals are afoot in both the lofty euphoric stock markets and depressed loathed gold market. Stock investors diversifying will lead the way. Their major GLD differential buying that is coming to help protect their portfolios will greatly accelerate gold’s young new up-leg. And gold’s gains will entice even more stock investors to participate by moving some of their own capital into GLD shares. This process will not only be self-feeding among the stock investors, but it will spawn major new buying in the crucial American gold-futures market as well. It wasn’t just American stock investors fleeing GLD shares that were responsible for 2013’s extreme gold downside anomaly, but American speculators aggressively dumping gold futures. And even though these guys recently reached selling exhaustion and started buying, they have a massive amount left to go to restore their total long and short gold-futures contracts to their normal years’ averages between 2009 to 2012. Stock investors buying GLD shares and futures speculators adding longs and covering shorts will work together to amplify gold’s coming upside. And the longer, faster, and higher gold rallies, the more it will motivate more investors to deploy capital to participate. This week’s incredible differential GLD-share buying is only the earliest vanguard of a major reversal getting underway in gold, it’s very exciting. Investors and speculators can certainly play gold’s big mean reversion higher in GLD shares, that’s the most-efficient and least-risky way. But since GLD’s mission is to mirror the gold price less this ETF’s annual 0.4% management fee, gold’s gains are the best GLD will see. Meanwhile the stocks of the gold miners, which were recently trading at fundamentally-absurd levels, will greatly leverage gold’s gains. The bottom line is American stock traders started pouring capital back into gold this week in a serious way. They bought GLD shares so aggressively that this ETF had to shunt enough stock capital into physical gold bullion to grow its holdings by their fastest pace in about 5 years. And this is likely just the beginning, as American stock investors remain woefully underinvested in gold and not prudently diversified. As the lofty overvalued U.S. stock markets inevitably roll over without Fed money printing forcing them higher any more, gold will gradually return to favor. Stock investors have vast GLD buying left to do to attain even a semblance of portfolio diversification. This massive buying is going to propel today’s low gold prices far higher, earning fortunes for contrarians brave enough to buy in early ahead of the herd. Copyright 2000-2015 Zeal LLC ( ZealLLC.com ) Additional disclosure: I am long extensive gold-stock positions which have been recommended to our newsletter subscribers.
Closed End Funds Vs. ETFs, Which Is Better For You?

CEFs have a long history behind them, but remain an obscure investment option. ETFs are fairly new to the investing world, but have a huge following. Which one is right for you depends on what you want from your investments. Some of the oldest closed-end funds, or CEFs, like Adams Express (NYSE: ADX ), trace their history back as far as the Great Depression. The oldest exchange traded funds, or ETFs, meanwhile, date back to only the early 1990s. But new and exciting things often get the most attention in the market, and ETFs have blossomed while CEFs continue to be the investment world’s unloved step child. That said, it’s worth looking at the pros and cons of the two products. You might just decide that unloved and obscure is more to your liking. What ETFs do well The one thing that ETFs do really well is cheap. Many ETFs have expense ratios in the 0.2% range. And their structure, which is fairly complex, is specifically designed to avoid passing capital gains on to shareholders, although that’s not always possible. This said, the cheapest ETFs are generally pure index following securities, tracking broad indexes like the S&P 500, for example. Newer ETFs are often set up to track more obscure indexes or slices of indexes. Or they have some screening overlay. Whether or not these variants cost more money to run or not is debatable, but ETF sponsors are certainly charging more. For example , the WisdomTree BofA Merrill Lynch High Yield Bond Negative Duration ETF (NASDAQ: HYND ), yes that is the ETF’s real name, has an expense ratio of 0.48%. Some ETFs are even more expensive. Unfortunately, many of the newer funds, like this one, really aren’t meant for novice investors. Closed-end funds, meanwhile, don’t do such a good job when it comes to costs. Adams Express is one of the cheaper options, with an expense ratio of about 0.6% according to the Closed-End Fund Association . It isn’t odd to see CEFs with expense ratios of around 2%. That’s a notable disadvantage compared to ETFs, though higher cost funds often make use of leverage, which elevates expenses but can help augment performance during good markets. (Leverage tends to exacerbate losses in bad markets.) ETFs also do a good job with diversification. With one relatively cheap security you can get exposure to a broad market index, a specialty index, or the list of stocks that pass some unique screening technique. While closed-end funds aren’t usually structured around an index, they too provide diversification. So, too some extent, this issue is a wash and I wouldn’t assign a clear winner either way. In fact, as ETFs have proliferated, they have become increasingly more obscure-a fact that could lead investors to buy something that may not be as diversified as they think. For example, nearly a third of the Energy Select Sector SPDR ETF (NYSEARCA: XLE ) is in just two stocks, Exxon Mobil (NYSE: XOM ) and Chevron (NYSE: CVX ). That’s a lot less diversification then you might be expecting. What ETFs do badly If you believe fully in the efficient market hypothesis, then buying index funds is the only thing you’ll ever do. And ETFs will be a great choice. However, I’ve found that markets are efficient on the whole, but not at all times. Investors often send stocks to unreasonable lows and unreasonable highs. At the low end, savvy investors can pick up bargains. At the high end, capitalization weighted indexes wind up over exposed to the best performers. That can lead to steep sell offs when investing tides start to turn since ETFs can’t decide to take profits and move on to another opportunity. ETFs that use fundamental screening techniques, equal weighting, and fundamental weighting all attempt to deal with this issue. But following an index means you are stuck with whatever that index is doing, even if you Jerry rig the index it to create a good sales pitch. Wisdom Tree’s entire business is built on using screening techniques and different weighting schemes, with products like the WisdomTree LargeCap Dividend ETF (NYSEARCA: DLN ), which invests in large cap dividend payers and is weighted by dividend. It’s a good story if you like dividends, but the yield is around 3.8% , not exactly a huge dividend story. And the portfolio is only rebalanced on an annual basis , look out if something bad happens to a top holding during the year. Closed-end funds, with human beings at the wheel, can make choices. That may be as base as getting out of the market during a downturn (index funds can’t do that) or buying a company that looks horrible based on numbers, but has some other attribute that suggests its luck is about to turn. Examples of that include things like a new contract or a change in management. And with no need to buy and sell shares every day like an open-end mutual funds, manager of closed-end funds have more freedom than the managers of most publicly available pooled investment products to do what they believe is best. This actually leads to one of my biggest pet peeves with ETFs-they can’t discriminate or choose not to. For example, an ETF that invests in the utility industry will likely own whatever utilities are large enough and liquid enough. The biggest utilities get the most money. That’s it, that’s the “magic” behind the ETF. It doesn’t matter what the regulatory environment is in a utility’s region, even though that’s an incredibly important factor in a utility’s future. As long as an ETF knows its a utility and can trade it, it’s in. CEF, the Reaves Utility Income Fund (NYSEMKT: UTG ), on the other hand, looks at regulatory environments , among other things, when assessing an investment. The human touch may raise the price of admission, but it can add value in many situations. What CEFs do exceptionally well One thing that CEFs do well that most other investments don’t, including most ETF and open-end mutual funds, is income. Many closed-end funds are specifically designed to pay investors a set monthly or quarterly distribution. With more and more baby boomers reaching retirement age, a steady income stream is going to be increasingly important. If that’s what you’re looking for, you should at least consider CEFs. There is a legitimate debate to be had about the implications of return of capital, which CEFs can use in bad years to sustain a distribution. That can lead to the fund’s net asset value falling over time if return of capital is used too often. However, in a bad market, you might have to dip into capital, too, if you were managing your own portfolio. And it’s important to note that return of capital is a complex issue. If the funds net asset value, or NAV, is going up, then return of capital isn’t that big a concern because it’s likely more of an accounting issue than anything else. Reaves, for example, has never cut its distribution and never used return of capital. The BlackRock Health Sciences Trust (NYSE: BME ) is another fund that’s done well over the long term with scant use of return of capital. That said, in fiscal 2014 return of capital accounted for roughly 2% of its fiscal 2014 distributions . Since the NAV was up over $5 during that year the $0.07 a share or so of return of capital really wasn’t a big deal. Another thing that closed-end fund do well is bargains. This is because they trade like stocks, but have portfolios like ETFs or mutual funds. Thus, the NAV of a closed-end fund can differ materially from its share price (in a truly efficient market this would be impossible, by my thinking). That can allow an investor to pick up $1 worth of investments for as little as $0.80. ETFs rarely trade far from their NAVs (open-end mutual funds never do). So if you like deals, CEFs win hands down. This or that So what type of investor would want an ETF? The most obvious choice is someone looking for the cheapest and easiest way to gain exposure to a given market or sector. For example, an investor looking for broad stock market exposure might choose the SPDR S&P 500 Trust ETF (NYSEARCA: SPY ), the granddaddy of S&P 500 ETFs, or for even more diversification, the Vanguard Total Stock Market ETF (NYSEARCA: VTI ), which essentially tracks the entire U.S. stock market. SPY’s expense ratio is 0.0945% and VTI’s expense ratio is an even smaller 0.05%. Pair these up with a bond ETF, like the Vanguard Total Bond Market ETF (NYSEARCA: BND ), and you have a diversified portfolio. BND’s expense ratio , by the way, is just 0.08%. With just two ETFs, you’d get exposure to every U.S. stock and bond with minimal expense. That said, not everyone wants to use a hands free approach. For more active investors, ETFs are also good for someone looking to time the market or jump into a hot sector without having to know much about the companies in it. Want exposure to technology because you think it’s about to take off? Try the Technology Select Sector SPDR ETF (NYSEARCA: XLK ). It’s relatively cheap and gives you a portfolio filled with some of the largest and most important tech names in the world. You can find an ETF for just about any sector you might be interest in jumping in and out of quickly. But, as I noted above, there can be drawbacks to investing in an index. The Reaves Utility Income Fund is a great example. Not all utilities are made equal and there are factors beyond being included in the S&P 500 Index that may make a utility worthwhile, or not. So by purchasing the Utilities Select Sector SPDR ETF (NYSEARCA: XLU ) you will quickly own the utilities in the S&P 500, but not necessarily the utilities best positioned within the industry. Reaves takes a broader look at the companies and industry. And if you are looking for income you’ll definitely want to look at CEFs, which do income better than most other pooled investment products. For example, pair the Gabelli Equity Trust (NYSE: GAB ) with the MFS Charter Income Trust (NYSE: MCR ) and you have a broadly diversified portfolio. And since GAB pays out $0.15 a share quarterly for an around 8% yield and MCR pays $0.045 a share every month for an around 7.5% yield, you’ll have a nice income stream to live off of. To some extent, these two funds were picked at random, but they get the point across. For comparison, VTI’s yield is around 1.8% and BND’s yield is about 2.7%. That’s a lot less to live on. In addition, if you like the idea of finding bargains driven by human inefficiencies, CEFs are the way to go. For example, GAMCO Global Gold, Natural Resources & Income Trust (NYSEMKT: GGN ) has a habit of selling for less than its NAV toward the end of the year with the gap closing as the new year progresses. Just such a trading opportunity took place this past month. But, longer term, you can find bargains, too, since many closed-end funds trade at discounts to their NAVs, often for long periods of time. That, in turn, increases the income you earn from the CEFs relative to owning the securities in the fund’s portfolio directly. A fund with a 10% discount to NAV means a fund paying you 10% more than you would get if you bought the same portfolio directly. MFS Charter Income Trust, for example, is trading at an over 10% discount according to the Closed-End Fund Association . Beauty is in the eye In the end, both ETFs and CEFs have their pros and cons. I’ve only touched on the issues I think most salient, I’m sure you can find some more things to like and hate about each. That said, they both have their place in the world of investing. If you believe there are inefficiencies in the market and like the idea of a human being being involved in the investment process, you’ll want to look at closed-end funds despite their negatives. If you prefer computer driven and cheap, then ETFs will be your masterpiece, even though they aren’t perfect. But, regardless of which one you pick, you should take the time to think about how their inherent strengths and weaknesses fit with your portfolio and personality. It could save you from jumping ship at exactly the wrong time or open you up to a whole new area of the investment world that you’ve never looked at before.

Southern Company Retains Appeal For Long-Term Investors

Summary Southern Company’s near-term may remain overshadowed due to ongoing construction projects. Ongoing capital expenditures will fuel rate base and long-term earnings growth. Attractive dividend yield of 4.1% makes SO a good investment for dividend-seeking investors. Southern Company (NYSE: SO ) is one of the leading energy companies in the U.S. utility sector. The company’s solid fundamental outlook is supported by its accelerated capital expenditures for several energy projects. In the near term, the company’s stock price can come under pressure due to its risk in delay and cost overruns for its ongoing projects, Kemper and Vogtle. But in the long run, once these projects are completed, they will help the company grow its rate base and fuel earnings growth. Also, as the company’s capital expenditures have been fueling its EPS growth, it will also fuel dividend growth for the company in the future. Currently, the stock has a dividend yield of 4.1%, which makes it attractive for dividend investors. Also, the low treasury yield environment will support the utility sector and SO’s performance in 2015. The following graph shows the low U.S. 10-year treasury yield. (click to enlarge) Source: Yahoo Finance Investors Have a Secure Long-Term with SO The company has been making capital expenditures to strengthen its electricity generation portfolio. Capital expenditures, which the company is making, are focused towards regulated operations, which will provide stability to its cash flows and earnings. The capital expenditures will also fuel long-term earnings growth for the company. As far as SO’s 582MW Kemper project is concerned, the project has been subjected to ongoing cost revisions and delays, and the issues of delays and cost overruns still prevail. As per the revised estimates, the project’s total cost will now reach $6.1 billion, an increase of $330 million as compared to previous estimates. However, the project is near completion and is expected to be completed by the end of 1H’15. In addition, the company is in the process of building two new nuclear power plants, Vogtle 3 and 4, with a power generation capacity of 2,200MW . These nuclear projects were previously estimated to be in running condition by the end of 2017 or 2018, but as per recent revisions, these projects are also expected to face operational delays. The Vogtle project is expected to experience a one-year delay and cost an additional $730 million to the company. Owing to these ongoing delays and expected cost increases, I believe the project will remain an overhang on its stock price performance in the near term. But in the long run, these projects will uplift SO’s production capacity and optimize its generational portfolio, which will help grow its rate base and earnings. In addition to these power generation projects, the company is bidding on the growth potentials of solar energy projects. SO is building a 131MW solar farm in Georgia, which is expected to be operational in 2016. The value of building this farm lies in generating healthy earnings growth for the company, by selling generated electricity to corporations through long-term power purchase contracts. Moreover, the company’s subsidiary Southern Power has accelerated acquisitions to improve the overall power generation capacity and to fuel its long-term earnings base growth. Southern Power won a bid for 100MW of solar projects in Georgia, and the subsidiary acquired the 150MW Solar Gen2 and 50MW Macho Spring solar facility. The company’s robust capital expenditures for future years will add to its rate base and long-term earnings growth. The company has plans to make capital expenditures of $17.4 billion from 2014-2016. The following chart shows the company’s expected capital expenditures for future. (click to enlarge) Source: Company’s Quarterly Earnings Report The company’s efforts to expand and strengthen its electricity generation portfolio will portend well for its long-term operational performance, and the capital expenditures will fuel its long-term earnings growth. Analysts are expecting a decent next five-year earnings growth rate of 3.63% for the company. Rewarding Investors SO has a strong history of rewarding its shareholders through healthy dividend payments. The company has a solid cash flow base to support its ongoing dividend increases. SO has recently announced a quarterly dividend payment of 52.50 cents . Currently, SO offers a high dividend yield of 4.10% , which is well covered by its cash flows, as indicated by the company’s strong dividend coverage ratio (Operating cash flows/ Annual Dividends) below. Based on the growth potentials of ongoing capital expenditures and large scale dependence on regulated operations, SO’s cash flow base will continue to grow at a decent pace. And owing to the company’s secure cash flow base, I believe SO’s dividends are secure and sustainable in the long run. The following table shows the company’s healthy dividend per share, dividend coverage and dividend payout ratio in the past three years, and for 2014 and 2015, based on estimates. Dividend Per Share Dividend Payout Ratio Dividend Coverage 2011 $1.87 73% 1.4x 2012 $1.94 73% 1.4x 2013 $2.01 75% 1.3x 2014(NYSE: E ) $2.10 74% 1.3x 2015( E ) $2.17 74% 1.3x Source: Company’s Annual Reports and Equity Watch Estimates Risks The company’s earnings growth faces risks of regulatory restrictions at the federal or state level, and an increase in environmental expenditure as directed by the EPA. Also, an increase in interest rates poses a risk to the stock price. Moreover, economic weaknesses in SO’s service territory are causing lower demand growth. Significant cost increases and delays due to the construction of Kemper and Vogtle plants, and unfavorable weather are key risks to the company’s future stock price performance. Conclusion The company’s near-term may remain overshadowed due to ongoing construction projects, but in the long run, as the construction projects will be completed and its generational portfolio will improve, its operational performance and stock price will be positively affected. The ongoing capital expenditures will fuel its rate base and long-term earnings growth. And as the company has significant regulated operations, it will portend well for its earnings and cash flows stability. Also, an attractive dividend yield of 4.1% makes it a good investment for dividend-seeking investors. Due to the aforementioned factors, I remain bullish on this stock.