How To Analyze Insider Selling
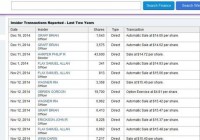
Summary Insider activity can be an extremely valuable tool when analyzing an investment. Insider buying is typically straight-forward, while insider selling is trickier to analyze. Insider sells should be analyzed by their size and frequency, the number of insiders selling, and insiders’ overall holdings and wealth. First Solar in 2007 – 08 provides a classic illustration of how large amounts of insider selling can be a red flag. If you told me that I had to invest in a portfolio of any 10 American companies for the next 3-5 years and I was only allowed to look at one metric or one data piece to make my decision, the choice would be a simple one. There’s no metric that can tell you more about a company that insider activity. In a world where corporate officers and directors are coached to “spin” their performance like politicians and are often incentivized to exaggerate results, insider activity lets you cut through the bullcrap and see what officers and directors of the company truly believe. Insider activity is often under-utilized by investors. Two likely reasons for this: (1) it’s inconclusive in the vast majority of cases and (2) it’s sometimes difficult to analyze. If you gave me a random sample of 100 companies, it’s likely that we would not be able to form a legitimate preliminary thesis on any more than 20 of these companies. And that’s being generous. In reality, no more than 3-10 will likely have significant activity in either direction. Yet, the few cases where there is significant insider activity provide us more insight than any other metric or data point out there. Analyzing insider buys can be reasonably straight-forward. If you see 2+ officers or directors buying significant amounts of shares at prices similar to the current stock price in the past six months, that’s generally a good sign. It means that these key individuals believe the company’s stock is undervalued and represents a good bargain. Of course, anyone can be wrong even about their own company, so it’s no guarantee of superior performance. Nevertheless, insiders know more about the company than anyone else and while their buying might not tell you much about macro conditions or the future price environment for their products, it does tell you what the insider think about their own company’s relative position. In most cases, that’s quite valuable information. Insider selling, however, is a much trickier piece of data to analyze I’ve heard many individuals discount the idea of looking at it entirely, but I think this is because people often find themselves frustrated with complex data series. Insider sales can be quite meaningful if you know how to analyze them. Diversification of Assets The first thing to note with insider sales is that they aren’t automatically “bad news.” Many insiders sell shares for perfectly legitimate reasons that have nothing to do with the stock’s valuation or company fundamentals. Put yourself in the shoes of an executive that has 90% of his or her wealth invested in one company. No matter how much you believe in your company and no matter how much of a bargain you believe the stock to be, it still makes sense to diversify a bit, so if the worst case scenario does happen, you still have a considerable bit of wealth. For this reason, it should be no surprise that executives at companies that have had good runs sell out of some of their shares in order to diversify wealth. Likewise, many executives and directors simply have other uses for the cash. This could include investments in other potential business opportunities, philanthropy, or real estate purchases. Indeed, it’s fairly common for high-level company stakeholders to sell shares, and that’s why insider selling can be tricky to analyze. This doesn’t mean it’s impossible, however. Insider Dumping There are several pieces of data to analyze when examining insider selling. I focus on: (1) Size of insider sells, (2) The number of insiders selling, (3) Frequency of selling activity, (4) Insider buys, and (5) Insider sells relative to total inside ownership Companies with consistent insider sells of large amounts by at least 3+ officers or directors, with little or few offsetting buys are the ones that give me cause for skepticism. This is particularly true with a company where inside ownership is fairly low to begin with (e.g. 2% – 3% of outstanding shares). That a director might need to take money out now and again is no surprise. Several officers and directors taking out large amounts of money in a short time frame, on the other hand, indicates a general pessimism on the company’s future stock prospects. Even in the odd event that company execs are selling large numbers of shares and the stock is undervalued, it would lead me to question management’s abilities. Management has a greater level of knowledge on a company than anyone else. If management can’t tell when their own stock is a good bargain, I have to suspect that they are also not good at understanding value in their own business, as well. Example #1: American Capital (NASDAQ: ACAS ) The reason this topic was on my mind was an excellent article from Stanislav Ermilov on American Capital . Stanislav’s thesis is that there is considerable hidden value at ACAS. He believes that once they spin off some of their assets, the much of that value will be unlocked. I found Stanislav’s case compelling enough to start looking at it myself. The first thing I did, naturally, was take a look at insider buying activity . I reasoned that if the officers of the company understood the “hidden value”, there would likely be a few that had been buying the hypothetically undervalued shares. Unfortunately, what I discovered was the exact opposite: officers have been dumping shares like mad. (click to enlarge) The screenshot above shows the past couple of months, but the track record of insider selling has been consistent over the past few years. Since December 2012, I estimate that there was a total of over $80 million in insider sales by at least 7 different officers and directors. Almost all of these sales have come at prices close to the current market price. I see no insider buying activity at all. No matter how compelling the thesis for ACAS might seem, I have to think there are some significant risks being missed. Unless Yahoo Finance is inaccurate (and it sometimes is), it also states that there is only 2% inside ownership for ACAS, which has a market cap of about $4 billion. 2% of $4 billion is $80 million. In other words, the insiders have sold off nearly half the shares in the past two years. I’m not necessarily suggesting that ACAS’s management is poor. Given that they make a lot of higher-risk investments, the company’s value would naturally suffer in market downturns. Perhaps, management merely thinks we’re near a cyclical peak. It is worth noting, however, that the stock lost 97% of its value during the last financial crisis. I have no opinion on ACAS and have done little research, but I know that the insider selling alone is enough to keep me away from it, even with a compelling “buy” thesis. Example #2: Zillow (NASDAQ: Z ) I’ve been skeptical of Zillow’s valuation for quite awhile. Indeed, I wrote an article, ” 7 Reasons Why Zillow is Extremely Overpriced ” back in August 2013. At the time I penned the article, Zillow sold for around $91 per share. As I’m writing this, it sells for $103, which is arguably a poor return over that 16-month period (13.1% versus 23.1% for the S&P 500), but hardly disastrous. However, this ignores the wild ride it’s taken in that timeframe, skyrocketing to $160 back in July, before plunging down to its current price. My thesis on Zillow hasn’t changed one bit. It still looks significantly overvalued to me at over 14x revenue, it is at best a break-even company, and its competitive position is weaker than typically imagined by investors (an issue repeatedly hammered on by short-selling outfit , Citron Research). Nevertheless, I’ve never recommended shorting it for precisely the reasons elucidated in the famous J.M. Keynes quote: ” the market can stay irrational longer than you can stay solvent .” While there are numerous reasons I view Zillow’s stock as overvalued, the insider sells paint a story that the officers of the company believe it’s overvalued, as well. Assuming my data is correct, I calculated over $1.4 billion in insider sales over the past 2 years, with a large chunk coming at lower prices than the current one (with the selling spree beginning around $40). The current market cap of Zillow is $4.2 billion, so the total insider selling amounts to 33.3% of the company’s current value. There are some differences between Zillow and ACAS. For one, the officers and directors of Zillow owned a much larger percentage of shares than their equivalents at ACAS. Moreover, it’s likely that many of the major stakeholders had a significant bit of their wealth tied up in Zillow. At the same time, once an officer sells over $20 million in shares in a few years, you have to think they have a pretty sizable cushion of safety and that insider selling becomes a statement on the value of the stock, rather than merely a “diversification strategy.” Even if 50% of your wealth is tied up in one company, that’s not a huge deal when your total wealth exceeds $50 million. I have and continue to view Zillow’s massive insider selling as a signal for long-term shareholders to get out until the price has significantly corrected; below the $50 range at a minimum. I personally wouldn’t even consider it unless the price fell below $35. Example #3: First Solar (NASDAQ: FSLR ) in 2008 Thus far, I’ve given you two current examples of stocks where the insider selling activity raises questions about valuation risks. But I also want to give you a historical example where massive insider dumping was quite predicative of an eventual crash in a stock. First Solar in 2008 is one of the most dramatic examples I can recall. First Solar peaked at over $310 in May 2008. It gave up 72% of its value in six months, plunging all the way to $87 in late November 2008 before rebounding. Since that point, it continued to lose value till bottoming out in June 2012 around $13. Today, it’s trading back at $44 meaning that if you bought at the peak and held, you would’ve lost over 85% of your investment. (click to enlarge) The dramatic insider selling activity in FSLR in 2007 and 2008 was a clear message that the stock was significantly overvalued. From May 2007, when FSLR sold in the $60 – $70 range, till August 2008, before the stock crashed, there were over $1.5 billion in insider sales. While that figure might arguably be inflated due to sales by the Estate of John T. Walton, there was considerable activity amongst the executives, as well, with CEO Michael Ahern selling over $350 million in shares in that 15-month window. When an executive holding a massive stake in his or her own company sells off $5 or $10 million in a year, it’s reasonable in many cases to assume that he or she is diversifying their portfolio. When he sells off $350 million, that’s a statement on the value of the stock! Conclusions In most instances, insider activity doesn’t tell us much about a stock. For the average company, there is little activity, or a handful of small sells. In the few instances, however, where there is a significant amount of insider activity, it can tell us quite a bit about management’s perception of valuation. Insider buying is relatively straight-forward to analyze. Significant buys by multiple insiders show that the people running the company have confidence in their performance and view the stock as undervalued. Insider selling is much trickier to analyze, but an equally valuable tool. In most cases, the activity that you see will be inconclusive at best. However, when there is significant activity, it should be analyzed by the size and frequency of sells, the number of insiders selling, and the overall context (e.g. overall stake in company by insider, portion of total wealth, relationship to company). When you see a clear and consistent pattern of share dumping by officers and directors, this is more often than not, a clear indication that a stock is overvalued.