Scalper1 News
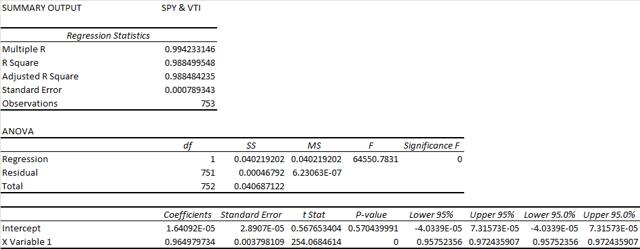
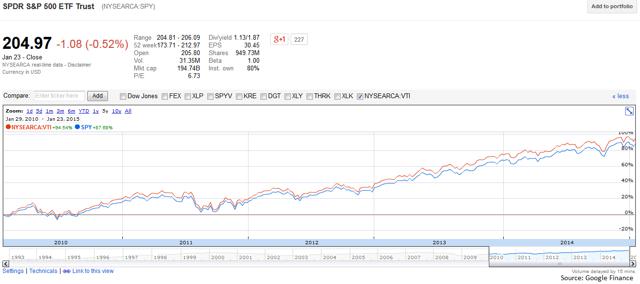
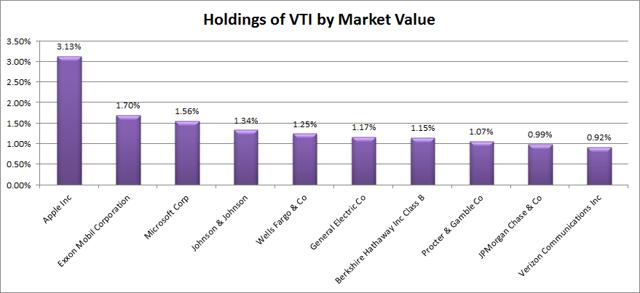 Summary VTI sounds like it offers significantly more diversification than SPY. The truth is VTI and SPY are extremely correlated, but that doesn’t make either a bad choice. I’m leaning towards using VTI as my replacement for SPY in my IRA account. When measuring standard deviation of returns, VTI looks slightly more risky than SPY, but that is a cost of including smaller cap equities. Investors should be seeking to improve their risk adjusted returns. I’m a big fan of using ETFs to achieve the risk adjusted returns relative to the portfolios that a normal investor can generate for themselves after trading costs. I’m working on building a new portfolio and I’m going to be analyzing several of the ETFs that I am considering for my personal portfolio. One of the funds that I’m considering is the Vanguard Total Stock Market Index Fund ETF (NYSEARCA: VTI ). I’ll be performing a substantial portion of my analysis along the lines of modern portfolio theory, so my goal is to find ways to minimize costs while achieving diversification to reduce my risk level. What does VTI do? VTI uses an indexing approach to track the performance of the CRSP U.S. Total Market Index. The first thing I’m looking for is diversification, so a total market index seems very attractive. However, I want to run my own statistics to get a better feel for the performance of the ETF. Does VTI provide diversification benefits to a portfolio? Each investor may hold a different portfolio, but I use the SPDR S&P 500 Trust ETF (NYSEARCA: SPY ) as the basis for my analysis. I believe SPY, or another large cap U.S. fund with similar properties, represents the reasonable first step for many investors designing an ETF portfolio. Therefore, I start my diversification analysis by seeing how it works with SPY. I start with an ANOVA table: (click to enlarge) The correlation measured on a daily basis is horrendous at 99.4%. I want to see low correlations, and this doesn’t seem to offer that. Looking at a price chart it is clear that the correlation is very high, but it is also clear that the over the course of several years the performance does deviate more than you might expect. See the chart below. (click to enlarge) It’s a little more difference in total return than would be implied by the 99.4% correlation. In short, there may be a tiny benefit to using SPY and VTI in the same portfolio. If investors are able to buy one but not the other without brokerage costs, I’d favor whichever could be traded freely. I wouldn’t expect the benefits of holding both over a long time period to justify the trading costs of rebalancing unless the investor had decided to only rebalance every few years. However, if an investor is still working and accumulating shares through regular purchases, I’d definitely favor only holding one. Therefore, I’ll be looking at VTI as a replacement to SPY rather than an addition. Standard deviation of daily returns (dividend adjusted, measured since January 2012) The standard deviation is great. For VTI it is .758%. For SPY, it is 0.736% for the same period. So, both have very similar levels of volatility. I prefer lower volatility, but I understand that some of the smaller cap investments will be more volatile than the S&P 500 so it isn’t very surprising. Why I use standard deviation of daily returns I don’t believe historical returns have predictive power for future returns, but I do believe historical values for standard deviations of returns relative to other ETFs have some predictive power on future risks and correlations. Liquidity is great The average trading volume is over 3 million shares per day. I have absolutely no liquidity concerns. Yield The distribution yield is 1.76% and the SEC yield is 1.80%. Those aren’t huge yields, but they are strong enough. This ETF could be worth considering for retiring investors. I like to see strong yields for retiring portfolios because I don’t want to touch the principal. Higher yields imply lower growth rates (without reinvestment) over the long term, but that is an acceptable trade off in my opinion. Expense Ratio The ETF is posting .05% for both gross and net expense ratios. That is absolutely incredible given that the ETF holds 3812 different securities. The portfolio turnover is only 4%, which is also attractive if you’re buying the ETF on the theory of efficient markets making it difficult to outperform through active selection. Market to NAV The ETF is at a .01% premium to NAV currently. That isn’t large enough to matter. Check before trading, but I wouldn’t expect to see this ETF deviate from NAV by a meaningful amount. Largest Holdings The diversification is very good in this ETF. My favorite thing about the ETF is easily the diversification. The top 10 holdings appear to be somewhat concentrated, but when you consider that there are over 3800 different securities in the total portfolio, it doesn’t concern me. This is simply a great ETF in my opinion. (click to enlarge) Conclusion I’m currently screening a large volume of ETFs for my own portfolio. I have a strong preference for researching ETFs that are free to trade in my account, so most of my research will be on ETFs that fall under the “ETF OneSource” program. After some consideration, I decided I wanted to overhaul my other accounts as well. While I favor the ETFs that are free to trade in my Schwab account, I have the opposite incentive in my other accounts. Since one account will hold several Schwab ETFs, I want the other accounts to hold other ETFs. Vanguard funds are very attractive, in my opinion, for any accounts that don’t already have commission free trading. In general they have low expense ratios and solid diversification. It’s difficult to decide if I should use VTI or SPY in my IRA (brokerage: USAA), but VTI has provided one of the best challenges I’ve seen for use as a replacement to SPY. There are some theories that the higher volatility of small companies causes investors to require higher returns and thus that small caps should have a higher expected level of performance. I’m not sure that I’m going to buy into that theory so quickly, but the price chart does provide some support. My current IRA uses some mutual funds that were relatively low fee with no trading costs. I want to make some fairly substantial changes. Over the course of a few months the trading commission on buying into SPY or VTI is easily saved through the even lower expense ratio. I’m leaning towards picking VTI over SPY for the IRA. Got an argument for why I shouldn’t? Let’s hear it in the comments. Additional disclosure: Information in this article represents the opinion of the analyst. All statements are represented as opinions, rather than facts, and should not be construed as advice to buy or sell a security. Ratings of “outperform” and “underperform” reflect the analyst’s estimation of a divergence between the market value for a security and the price that would be appropriate given the potential for risks and returns relative to other securities. The analyst does not know your particular objectives for returns or constraints upon investing. All investors are encouraged to do their own research before making any investment decision. Information is regularly obtained from Yahoo Finance, Google Finance, and SEC Database. If Yahoo, Google, or the SEC database contained faulty or old information it could be incorporated into my analysis. The analyst holds a diversified portfolio including mutual funds or index funds which may include a small long exposure to the stock. Scalper1 News
Scalper1 News