Tag Archives: alt-investing

Use Market Dips To Buy VTI

Low rates will push stocks higher well in to 2016. Passive ETFs are still the best bet for average investors. VTI offers greater diversification, stronger performance, and lower fees than SPY. The purpose of this article is to discuss the attractiveness of the Vanguard Total Stock Market ETF (NYSEARCA: VTI ) as an investment option. To do so I will review the funds recent and long-term performance, current holdings, and trends in the market to determine if this investment is suitable for average investors. VTI has performed very strongly over the past few years, but with some serious headwinds on the horizon, it makes sense to revisit this investment strategy and see if it has the potential to be as profitable in the new year. First, a little about VTI. VTI attempts to track the performance of the entire stock market, unlike other popular ETFs, such as the SPDR Dividend ETF (NYSEARCA: SDY ) or the iShares Select Dividend ETF (NYSEARCA: DVY ), which track specific companies within the S&P 500 or Dow Jones, respectively. Th e fund is designed to track the performance of the CRSP U.S. Total Market Index and does so by holding stocks that are large, mid, and small-cap. As of 5/31/2015, VTI has 3824 stocks in its portfolio, making it one of the most diversified funds you can buy. Currently, VTI is trading at $107.95/share and pays a quarterly dividend of $.47/share, giving the fund an annual yield 1.74%. Year to date, the fund is up roughly 2% and over the past year the fund is up around 6% (both figures exclude dividend payouts, which would increase its total return). While VTI does not just track the Dow or S&P 500, it is worth noting that the investment has slightly outperformed those benchmark indexes over the past year, as they returned 5.5% and 6% , respectively. (Dividends give VTI its superior return.) Aside from its strong historic performance there are a few other reasons why I believe VTI will continue to outperform over the next 12-18 months. First, I expect stocks to continue to rise going in to 2016 because of macroeconomic events that will benefit the U.S. economy. Interest rates are going to stay low until at least the end of next year, U.S. hiring is coming to show grow – lowering the unemployment rate, and wages may finally be starting to climb for the average U.S. worker. Given these trends, I would look to increase positions in U.S. equities during market dips on issues such as Greek debt or other international concerns such as flare-ups in the Middle East. The U.S. economy is pushing forward, and the bigger trends over the next year will outweigh current headwinds and should increase stock prices. Let’s look at each point in turn, starting with interest rates. The on-going discussion on when the Federal Reserve will raise their key benchmark rate has been influencing the market for years. Most predictions indicate that in September, the Fed will finally increase rates for the first time since the financial crisis. When we get closer to that date, expect to see some volatility in the market and there is a chance equities could move lower as higher rates have the potential to curtail growth and stall the recovery. However, I think these fears are overblown and will provide investors with another good buying opportunity. While I just mentioned that interest rates are set to rise, the increases are sure to be modest and slow. In fact, Janet Yellen indicated, after the most recent Fed meeting, that interest rates will rise slower than previously anticipated . The current consensus now is that rates will not exceed 2% by the end of 2016, meaning that the U.S. will continue to experience a historically low rate environment for at least another year and a half. I think that the market will benefit under these conditions, as the Fed will be signaling that the U.S. economy is strong enough to stand on its own, yet rates will still be low enough to encourage investors to search for a greater return in the stock market. Second, U.S. hiring has been steadily increasing and the Labor Department recently reported that, while the number of people seeking unemployment aid rose slightly last week, the figures remained at a historically low level that signals “an improving job market.” Job growth is especially important for the stock market as the resulting domino effects, such as increased consumer spending, increased demand for housing, and greater consumer confidence, are all positive for equities. In fact, these trends are already beginning to take hold as The Commerce Department recently reported that consumer spending rose 0.9 percent last month (May). Finally, wages, a drag on the U.S. economy for some time, may be finally starting to rise. An increase in wages will benefit the economy and stocks much in the same way that the improving employment figures will, discussed in the previous paragraph. May’s figures indicate that the “average wage of American workers rose 0.3% in May to $24.96 a hour, pushing the increase over the past year up to its highest level since mid-2013.” If this trend continues, inflation will start to increase and equities will continue their march higher, directly benefiting VTI. While the trends I just talked about will benefit VTI, they will also benefit most equity investments, so I will now point out why I prefer VTI to other similar investments, such as the SPDR S&P 500 Trust ETF ( SPY). VTI and SPY have almost identical returns over the past year and pay similar yields of 1.85% and 1.94%, respectively. However, over the past five years VTI has beaten SPY with a return of over 96% compared to a return of just under 93% for the SPY. So longer term, VTI seems to be a stronger bet, and there are a few reasons for this. One, VTI covers the entire stock market, and thus has exposures to stocks in the Dow Jones Index, S&P 500, and the Nasdaq. Therefore, when, for example, technology stocks in the Nasdaq outperform, VTI will benefit to a greater degree over the SPY. This additional exposure provides a greater chance of upside in a rising market, which is what I expect to happen. I mentioned that VTI has over 3800 stocks in its portfolio, this compares with 500 for the SPY , giving investors greater diversification. Also importantly, VTI sports a lower expense ratio than SPY, at .05% for VTI compared to .1098% for SPY . While the difference is not huge, how could one argue that paying less for greater diversification is a bad thing? With more holdings, a superior long-term return, and a cheaper cost to own, VTI seems the obvious choice. Of course, investing in VTI is not without risk. The stock market is headed in to a time period of uncertainty, as we enter uncharted territory with events such as a Greek exit from the Eurozone and an increase in interest rates from the Fed for the first time since the recession. The market could hit a period of volatility that sends stocks sharply lower. Additionally, employment figures could stall, giving employers added leverage to keep a lid on wages and, in effect, inflation. Finally, rates could rise faster than anticipated, which could send investors away from equities and into safer investments that would then offer a higher yield, which would hurt the stock market overall and take VTI lower. However, these are not scenarios I expect to occur. The U.S. economy has increased consistently, and I expect domestic growth will outweigh scares from abroad, such as Greece. Additionally, the Fed has repeatedly noted it is mindful that raising rates too fast could derail the recovery, so I do not expect them to be too aggressive, too quickly. Bottomline: The stock market been on an incredible bull run over the past few years and VTI, as it covers the entire stock market, has directly benefited. Heading in to summer, headwinds exist that could send stocks sharply lower. However, these are perfect opportunities to “buy the dip,” as the U.S. economy is proving each month, through employment and consumer spending figures, that the rebound is real and sustainable. VTI should continue to increase as rates, while set to increase, will remain low through 2016 and passive investors continue to favor cheap ETFs that offer broad exposure. VTI offers investors a cheap way to gain exposure to the entire stock market, and also a history of outperforming the S&P 500 and its flagship ETF, the SPY. Because of this, I would encourage investors to consider VTI as an investment option on each, and any, market drop we have over the next few months. Disclosure: I am/we are long VTI, SPY, DVY. (More…) I wrote this article myself, and it expresses my own opinions. I am not receiving compensation for it (other than from Seeking Alpha). I have no business relationship with any company whose stock is mentioned in this article.
When Should You Sell A Mutual Fund?

Lipper’s Jake Moeller examines some qualitative reasons to reconsider holding a mutual fund investment. Investors interested in this topic can also register to attend the Lipper UK Fund Selector & Fund of Funds Forum in London on July 14, 2015. As a former fund-of-funds manager, Lipper clients regularly ask me about sell triggers for mutual funds. This question is quite amorphous; there are many factors that could result in a fund no longer being “fit for purpose,” but that depends on how the fund is being used. When investors blend funds into a portfolio, they have different tolerances for a sell decision than when, for example, they hold a single fund in isolation. When I managed a guided-architecture platform from which I constructed a number of portfolios, I would often sell a fund out of my portfolios but still keep it on the guided-architecture platform. Such decisions are uniquely a factor of what fund selectors call “style bias.” A large-cap fund, for example, might underperform considerably in a sustained mid-cap rally, but that doesn’t mean it is a poorly managed fund. The following factors are some key reasons to consider letting a fund go: Fund manager departure Fund managers move house for myriad reasons: ambition, retirement, redundancy to name a few. If the departure is restricted to a single manager, this is generally a “hold and wait” situation. Many investors will follow the new fund manager, but a large fund house should have contingency protocols in place and the performance of the old fund shouldn’t necessarily head south. Where a fund house is very quiet about a key departure, there may be a legal covenant underpinning an unpalatable situation. A single fund manager departure can also signal the start of distracting team restructuring and destabilization. Respect the fund house that gets information out early. The less that is said, the stronger the sell signal. “Activeness” A fund manager who closely tracks an index may be doing so for perfectly legitimate reasons: a lack of conviction, a portfolio restructure, or staff changes can result in emergency indexing. It is the duration of this positioning that matters. An active equity fund manager’s maintaining an index position for over three months, for example, would certainly be a red flag. Marketing support Often overlooked in importance: when a fund house stops marketing a fund or has another flavour of the month, this can often be a bad sign. “Legacy” funds are often poorly managed, and with little inflow they potentially leave investors languishing at a disadvantage. The retrenchment of sales directors can often be another leading indicator that funds might switch to legacy footing or that they are expecting less supportive inflows into their business. Corporate activity A takeover, acquisition, or merger requires considerable analysis, but it can be reduced to a very fundamental issue: cultural compatibility. Not many strategic bond managers, for example, would take well to a new parent company’s investment committee favoring utilities at any cost “because that’s best for our balance sheet.” Capacity A fund that becomes too large to maintain a manageable number of securities in its portfolio is likely to become either an index hugger or to compromise the technical expertise of its manager. There are so many quality boutique funds in the market that there is no excuse for holding an active fund that has say 2,000 securities in it. Outflows Outflows in and of themselves are not always a concern. However, when they coincide with a falling share price (where the fund manager is listed) and poor performance, you have a pretty strong sell signal. You will want to get out before all the cabs have left the rank. Round peg, square hole Has your fund house recently appointed a head of U.K. equities for your U.S. portfolio? Fund management is a specialized task and is only rarely truly portable. An expertise in one area does not guarantee expertise in another. Such an appointment warrants critical review. Courage under fire If fund managers are underperforming when their style should be in favour, an investor needs to question the skill of the managers; most fund managers make bad calls in their career but restore faith by sticking to their guns. If poor stock selection results in a fund manager “tweaking” the process or compromising philosophies, this should act as a warning flag. Poor performance Differentiate symptom and cause. Poor performance needs to be understood, not reacted to blindly. Where poor performance is a result of style biases or out-of-favor portfolio selection, one may likely end up selling just as the fund turns around. Where poor performance coincides with any of the qualitative factors outlined above, it is unlikely to be coincidence. Furthermore, these factors may occur before performance starts to be affected. Such factors warrant serious consideration to saying adieu to a fund.

Do Hedge Fund ETFs Live Up To Their Hype?

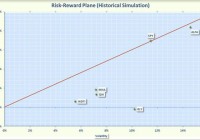
Summary Hedge fund ETFs provide a convenient way for retail investors to gain exposure to hedge fund strategies. Some, but not all, hedge fund ETFs were relatively uncorrelated with the S&P 500. Hedge fund ETF performances have been uneven, with some funds outperforming while others lagged. Hedge funds offer investors an alternative to traditional investment funds. Hedge funds can use leverage to increase returns and can also invest in a wide range of derivatives and short positions. Over the years some have scored phenomenal successes while others have suffered spectacular losses. Hedge funds are not currently regulated by the Securities and Exchange Commission (SEC) so only “accredited investors” can participate. Accredited investors must have a net worth of at least a million dollars or an income greater than $200,000 a year. Even if you meet the financial requirements, most funds charge a 2% management fee plus take 20% of the profits. These high charges are not for me so I looked for some alternatives to hedge funds among the plethora of Exchange Traded Funds (ETFs). The hedge fund ETF category includes funds with a variety of strategies including convertible arbitrage, managed futures, merger arbitrage, and tend following. Note that the ETFs in this category do not actually invest in hedge funds but instead try to replicate hedge fund performance. There are currently 22 ETFs in the hedge fund category but only five have assets over $100 million. These larger ETFs are summarized below. IQ Hedge Multi-Strategy Tracker ETF (NYSEARCA: QAI ). This ETF is based on techniques called “hedge fund replication” that try to reproduce hedge fund returns using a portfolio of conventional assets. The fund goes long or short other ETFs in an attempt to replicate the risk-adjusted performance of a mix of hedge funds. QAI uses a rules based momentum strategy to decide which assets to buy or short. The portfolio can change monthly depending on the economic environment but generally this fund maintains a large net long allocation to bonds, which can be rotated among Treasuries, corporate bonds, floating rates, high yield, and convertible bonds. The fund also invests in equities, currencies, commodities, and REITs. The effective duration of the bond portion of the portfolio is a little over 4 years. The fund has an expense ratio of 0.91% and yields 1.3%. This is the largest hedge fund ETF with an asset base of over $1 billion and a daily average volume of more than 180,000 shares. IQ ARB Merger Arbitrage ETF (NYSEARCA: MNA ). This ETF invests in global companies where there has been an announcement of an imminent merger or takeover. Merger arbitrage attempts to capture the difference between the current price of the takeover target and the final price. This is a market neutral strategy that has typically been relatively low risk. The fund currently has 58 holdings with 45% in US stocks, 15% in non-US stocks, and 40% in cash. The expense ratio is 0.76% and the fund does not generate any yield. The daily volume averages only 23,000 shares so limit orders should be used when buying or selling this fund. WisdomTree Managed Futures Strategy ETF (NYSEARCA: WDTI ). This actively managed WisdomTree ETF provides returns based on the Diversified Trend Indicator (DTI). DTI is a trend following, quantitative strategy developed by Victor Sperandeo (also known as “Trader Vic”). The DTI is used to go long or short futures associated with 24 components in 18 sectors. The futures cover a wide range of the liquid future markets including currencies (50%), energy (19%), livestock (5%), precious metals (5%), industrial metals (5%), and agriculture (16%). The fund is rebalanced monthly. The expense ratio is 0.95% and the fund does not have any yield. The daily volume averages only 34,000 shares per day so limit orders should be used when buying or selling this fund. AlphaClone Alternative Alpha ETF (NYSEARCA: ALFA ). This ETF invest in the securities that are widely held by hedge funds and institutional investors. This strategy is possible because hedge funds that manage more than $100 million must periodically disclose their equity holdings. The selection of the securities is based on a proprietary index methodology. The portfolio is also risk-managed and can vary from long-only to a heavily hedged position. The portfolio currently consists of 74 holdings with 83% from the US and 17% international. The sector breakdown includes 24% technology, 20% health care, 14% consumer staples, and 14% industrials. The expense ratio is 0.95% and the fund yields less than 1%. The daily volume averages only 22,000 shares so limit orders should be used when buying or selling this fund. SPDR Multi Asset Allocation ETF (NYSEARCA: RLY ). This is an actively managed ETF that is focused on securities that traditionally provide good inflation hedges. The portfolio consists of 12 ETFs, with a focus on inflation-linked bonds (19%), commodities (17%), REITs (20%), and natural resource companies (38%). The fund has an expense ratio of 0.70% and yields 2.3%. The daily volume is extremely small with an averages of only 5,000 shares so limit orders should be used when buying or selling this fund. For reference I also included the following funds in the analysis: SPDR S&P 500 Trust ETF (NYSEARCA: SPY ). This ETF tracks the S&P 500 index and has an ultra-low expense ratio of 0.09%. It yields 1.9%. SPY will be used to compare the performance of the hedge fund ETFs to the broad stock market. To assess the performance of the hedge fund ETFs, I plotted the annualized rate of return in excess of the risk free rate (called Excess Mu in the charts) versus the volatility for each of the funds. I used 1% as an estimate for the risk-free rate. I would have liked to see how these ETFs performed during the 2008 bear market but the oldest fund was not launched until 2009. Most of the other funds only have a 3 year history so I used a 3 year look-back period from June, 2012 to June, 2015. The Smartfolio 3 program was used to generate the plot shown in Figure 1. (click to enlarge) Figure 1. Risk versus reward over past 3 years Figure 1 illustrates that the hedge fund ETFs have had a large range of returns and volatilities. To better assess the relative performance of these funds, I calculated the Sharpe Ratio. The Sharpe Ratio is a metric, developed by Nobel laureate William Sharpe that measures risk-adjusted performance. It is calculated as the ratio of the excess return over the volatility. This reward-to-risk ratio (assuming that risk is measured by volatility) is a good way to compare peers to assess if higher returns are due to superior investment performance or from taking additional risk. In Figure 1, I plotted a red line that represents the Sharpe Ratio associated with SPY. If an asset is above the line, it has a higher Sharpe Ratio than SPY. Conversely, if an asset is below the line, the reward-to-risk is worse than SPY. Some interesting observations are evident from the figure. With the exception of ALFA, these funds were significantly less volatile than the S&P 500. However, this decrease in volatility was accompanied by an even larger decrease in return. Therefore, with the exception of ALFA, SPY easily outperformed these hedge funds on a risk-adjusted basis. ALFA was the best performer among all the hedge fund ETFs (on both an absolute and risk-adjusted basis). This is not too surprising since piggybacking on the equity portfolio of hedge funds would be expected to perform well in a bull market. However, ALFA was very volatile and slightly under-performed SPY on a risk-adjusted basis. RLY was the worst performer. Again, this was not surprising since inflation has been tame and precious metals have been in a bear market. WDTI had the lowest volatility but also a relatively low return that only beat RLY. Even though MNA and QAI employed different strategies, they booked similar risk-adjusted returns. One of the advertised advantages of hedge funds is the low correlation with the stock market. To assess the validity of this claim, I calculated the pair-wise correlations between the funds. The results are shown as a correlation matrix in Figure 2. The symbols for the funds are listed in the first column and along the top of the figure. The number at the intersection of the row and column is the correlation between the two assets. For example, if you follow WDTI to the right for two columns you will see that the intersection with MNA is 0.004. This indicates that, over the past 3 years, WDTI and MNA were only 0.4% correlated. Note that all assets are 100% correlated with themselves so the values along the diagonal of the matrix are all ones. Figure 2. Correlation matrix over past 3 years The figure illustrates that, with the exception of ALFA, hedge funds provide good diversification relative to the overall stock market. As you might expect, ALFA is highly correlated with SPY since the portfolio of ALFA consists of popular stocks from the S&P 500. The managed futures fund, WDTI, is basically uncorrelated with all the other funds so it provides excellent diversification. The other ETFs (MNA, QAI, and RLY) are only moderately correlated with each other and the stock market.. For my last analysis, I reduced the look-back period to 12 months. The results are shown in Figure 3. What a difference a couple of years make. During this period, both WDTI and MNA performed well and had essentially the same risk-adjusted return as the overall stock market. ALFA again was the best performer and actually beat out the S&P 500 on both an absolute and risk-adjusted basis. RLY as again the worst performer, sinking well below the zero line. (click to enlarge) Figure 3. Risk versus reward over past 12 months. Bottom Line Hedge fund ETFs cannot all be lumped together and some lived up to their hype while other did not. ALFA was by far the best performer but it is highly correlated with the S&P 500. If you are looking for a hedge against a stock market correction, I would not use ALFA. However, if you are risk tolerant and want exposure to the overall market, ALFA is worth consideration. As a hedge, I like WDTI and MNA. These are low volatility funds, have a reasonable return, and are relatively uncorrelated with the stock market. In a bull market, these funds will lag but I do think they have lived up to their reputation as a vehicle to hedge the market. Unfortunately, the most popular fund, QAI, has not lived up to its hype. RLY may do well in the future but until inflation increases, I would avoid this fund. Disclosure: I/we have no positions in any stocks mentioned, and no plans to initiate any positions within the next 72 hours. (More…) I wrote this article myself, and it expresses my own opinions. I am not receiving compensation for it (other than from Seeking Alpha). I have no business relationship with any company whose stock is mentioned in this article.