Tag Archives: alt-investing

The Drop In How Many U.S. Stocks Equaled 1 Greek Economy?
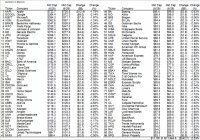
The article shows that the capitalization change of a small number of large-cap U.S. stocks equaled the entire annual output of the Greek economy. This effort is in part to frame the impact Greek turmoil is having on U.S. assets. A qualitative discussion of whether this capitalization change is warranted is included. The title of this article asks readers to guess the number of U.S. stocks whose reduction in market capitalization on Monday was equivalent to the size of annual Greek economic output. The answer: 86 To come up with the figure, I compared the gross domestic product of the Greek economy from the World Bank to the capitalization change of the largest components of the S&P 500 (NYSEARCA: SPY ) by market capitalization until the change in value equated to the Greek GDP of $242B. I had some notable takeaways from this data that I wanted to share with readers. The question for market participants is whether these moves are justified. If the value of an asset is its future cash flows discounted back to the present, then the reduction in domestic equity prices on Monday was either a function of an expectation of lower future cash flows and/or a higher discount rate. The former, lower future cash flows, seems unlikely to have had a large impact given the limited trade between the U.S. and Greece and the fact that the Greek economy is roughly the size of the Minneapolis-area economy. The negative translation effect of broader global cash flows earned by these U.S. companies from a strengthening U.S. dollar would have had a proportionately larger impact. That means that the re-pricing of risky assets is more likely a function of a higher discount rate. The interest rate component of the discount rate fell on Monday as U.S. rates rallied on a flight-to-quality bid signaling that an “equity risk premium” applied to U.S. equities increased to move the discount rate higher. While the outcomes from a potential “Grexit” remain uncertain and difficult to analyze, the transmission mechanism for broader global contagion seems equally uncertain. The potential financial sector link, which roiled equity markets in 2012 given the amount of Greek debt held by European banks at the time, appears to have been muted by a rotation of Greek debt from bank balance sheets to official creditors, enhanced stability mechanisms, European quantitative easing, and much lower yields in the periphery. While the odds of a disorderly outcome in Europe are certainly rising, investors must handicap how much of a risk premium on global assets is justified. While we are likely to continue to see heightened volatility in the near term, if the Greek drama was responsible for the entirety of the move on these 86 companies, I believe that the impact has been overstated already. Disclaimer : My articles may contain statements and projections that are forward-looking in nature, and therefore inherently subject to numerous risks, uncertainties and assumptions. While my articles focus on generating long-term risk-adjusted returns, investment decisions necessarily involve the risk of loss of principal. Individual investor circumstances vary significantly, and information gleaned from my articles should be applied to your own unique investment situation, objectives, risk tolerance, and investment horizon. Disclosure: I am/we are long SPY. (More…) I wrote this article myself, and it expresses my own opinions. I am not receiving compensation for it (other than from Seeking Alpha). I have no business relationship with any company whose stock is mentioned in this article.
VNQ Share Fall, Yields On REITs Rise As Treasury Yields Fall

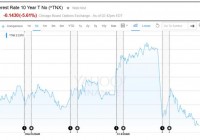
Summary The Vanguard REIT Index ETF appears to be on sale. Despite falling treasury yields and rising prices for utilities, equity REITs are showing weakness. I believe we are seeing a flight to quality as investors angle for more conservative assets. For investors that believe the markets are reasonably efficient, it makes sense to hold a large position in a low fee ETF like the Vanguard REIT Index ETF (NYSEARCA: VNQ ). I believe the markets are reasonably efficient, but I also believe that fear and greed occasionally overpower rational analysis and we see movements that fail to make adequate sense. On June 29th, it appears that fear was the emotion of the day and VNQ was becoming even more attractive. The Fear If you haven’t heard already, there are some issues in Greece. The Greek banks and their stock market are closed for the day and there are expectations of a payment due to the IMF to be missed. There was a nice little piece on it in the SA news feed earlier in the day . The piece there contains a little more information for readers that are interested. Rather than repeat the issues with Greece, I want to focus on the irony in the interest rate market. Let us begin with a look at a yield chart I pulled from Yahoo: (click to enlarge) The yields fell sharply lower today. If an investor is simply interested in what level of yield they can get on their investment, this should indicate that too many people are buying bonds and that they should be less attractive. By comparison, other sources of income should be more attractive. They should see prices increases and yields fall. However, that is precisely not what we saw with the Vanguard REIT Index ETF. I put together a quick chart from Google showing the price movements for VNQ and the Utilities Select Sector SPDR ETF (NYSEARCA: XLU ). (click to enlarge) As you can see, the movements previously were relatively similar and this morning they both jumped higher, but since then VNQ has been trading down while XLU has maintained part of the gain. My Take I’m seeing yields falling on treasury securities as investors have a “flight to quality”. Since the treasury securities are seen as the most reliable investment available, that is where the money is being placed. We see the same logic over the course of the day as investors are picking XLU over VNQ. The theory may be that if economic conditions worsen, the utilities will still have safe profit margins. Renters can move in with their parents and stop renting an apartment, but they won’t stop consuming electricity. The logic makes sense in the context of a flight to quality, but it ignores everything else about the business. I’d Rather Have REITs Owning a piece of the utility companies is a reasonable choice for portfolio diversification and very reasonable for investors focused on dividend yields. However, REITs remain an extremely attractive investment for the tax advantaged accounts. In my opinion, VNQ is a screaming buy relative to the 10 year treasury. The yield on VNQ just broke 4%. It is offering investors substantially higher levels of income than the Treasury, though I will grant it is also a significantly riskier security. The reason the risk is worth it can be viewed in the long term context. When we focus on investing and buying yield rather than on short term price movements, it is reasonable to say that an investor buying a bond should expect to achieve roughly the yield to maturity if they hold the security to maturity. In the event of a zero coupon bond (no reinvestment risk), we would expect precisely that yield absent any brokerage costs. When it comes to income, the investor in VNQ would need to see future dividends fall by over 40% before they would receive less in their yield on VNQ than they would on investing in the treasury security. It could happen, at least theoretically equity REITs could find themselves forced to reduce dividends if the economic environment worsens and revenues decline, however I have yet to see any plausible argument for a 40% reduction across the industry. The worst year for VNQ when measured in dividends paid out was 2010. The total dividend payment was $1.89. Compared to the current share price, that would still result in a 2.52% yield. Acceptable Capital Losses If we assume that dividends will average roughly the same level they are at now over the next ten years, then we have superior performance by about 1.7% per year. Using simple math, the premium in yield would compound to just over 18% in ten years. So long as VNQ ended the period with the share price falling by less than 18%, the shares would have delivered a superior total return. The most logical case for VNQ to underperform treasury investments would be a substantial cut in dividends that matches a substantial decline in share price as investors would continue to expect a reasonable yield on new investments. In that manner, if dividends were cut to less than $2.00 per share, I would expect capital losses to easily surpass the acceptable levels. I find that scenario to be very improbable. On the other hand, since late 2004 through early June VNQ delivered a CAGR (compound annual growth rate) counting reinvested dividends of 8.75% per year. Over the next decade I’m expecting the dividends to grow on average by 4% to 5% per year and I’m expecting share price to grow at a slightly slower rate as higher interest rates on bonds will require higher yields from other income securities. Conclusion I’m long VNQ and I have a buy-limit order to add to my REIT holdings. I’m hoping to see the major REIT index funds decline more over the next year so I can keep adding to my positions at prices I consider attractive. I’m not just rebalancing into more REIT investments; I’m increasing my exposure to equity REITs because I see attractive long term investment opportunities. The situation right now resembles a falling knife, but I see it as a falling knife of gold. I may get cut several times as I keep buying into the REIT sector, but the long term expected returns at these yield levels are enough to keep me happily buying more. Disclosure: I am/we are long VNQ. (More…) I wrote this article myself, and it expresses my own opinions. I am not receiving compensation for it (other than from Seeking Alpha). I have no business relationship with any company whose stock is mentioned in this article. Additional disclosure: Information in this article represents the opinion of the analyst. All statements are represented as opinions, rather than facts, and should not be construed as advice to buy or sell a security. Ratings of “outperform” and “underperform” reflect the analyst’s estimation of a divergence between the market value for a security and the price that would be appropriate given the potential for risks and returns relative to other securities. The analyst does not know your particular objectives for returns or constraints upon investing. All investors are encouraged to do their own research before making any investment decision. Information is regularly obtained from Yahoo Finance, Google Finance, and SEC Database. If Yahoo, Google, or the SEC database contained faulty or old information it could be incorporated into my analysis.

Will UNG Resume Its Descent?

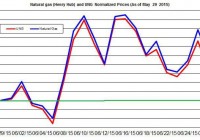
The price of UNG is up for the month on account of stronger demand in the power sector. Despite warmer weather, the cooling degree days are expected to reach normal levels this week. The normal cooling degree days could suggest the demand for natural gas in the power sector will cool down. The recent natural gas report showed the injection to storage was 75 Bcf, which was slightly lower than market expectations. Moreover, the latest buildup was below the 5-year average and last year’s injection. This news has provided a short-term boost for the shares of the United States Natural Gas ETF (NYSEARCA: UNG ) during last week. The price of UNG is slightly up for the month, but it will require a stronger demand for natural gas to bring UNG further up. For now, this scenario doesn’t seem likely. Before reviewing the latest developments in the natural gas market, shares of UNG continue to underperform natural gas prices: The impact of the roll decay on the price of UNG is demonstrated in the chart below (the prices are normalized to the end of last month). As you can see, the price of UNG rose by only 3.5% during June, while the Henry Hub by nearly 5%, i.e. a 1.5 percentage point difference. (click to enlarge) Source of data taken from EIA and Google finance According to the weekly EIA report , this week’s injection was the first time for this season to be below the 5-year average buildup. As of last week, the storage was 38% higher than the level recorded last year and 1.4% above the 5-year average. (click to enlarge) Source of data taken from EIA From the supply side, production picked up – it rose by 1%, week over week. And it’s up by 5.5% compared to last year. Based on the latest update by Baker Hughes , the number of gas rigs slightly rose by 5 to 228 rigs. Nonetheless, U.S. consumption also grew by 2.4% last week and was up by 8.5% for the year. Most of the growth in demand came in the power sector – 6.1%. This gain was partly offset by lower consumption in the industrial and residential/commercial sectors. Looking forward towards the next two weeks, the weather is expected to heat up mostly in the coastal line, including West, Northeast and South Atlantic, but the temperatures are projected to be lower than normal for this time of the year in parts of the Midwest. Despite the expected higher than normal temperatures in parts of the U.S., the cooling degree days are estimated to be only slightly higher than normal – this could suggest the rise in consumption in the power sector will slowdown. This could explain why the markets estimate this week’s injection will be close to the 5-year average buildup of 75 Bcf. The natural gas market slightly heated up in the past few weeks, but over the short run the power sector isn’t expected to heat up. Thus, the demand isn’t likely to pressure up the price of natural gas. For UNG, this could mean another pullback in its price. For more see: On the Contango in Natural Gas Market Disclosure: I/we have no positions in any stocks mentioned, and no plans to initiate any positions within the next 72 hours. (More…) I wrote this article myself, and it expresses my own opinions. I am not receiving compensation for it (other than from Seeking Alpha). I have no business relationship with any company whose stock is mentioned in this article.