Scalper1 News
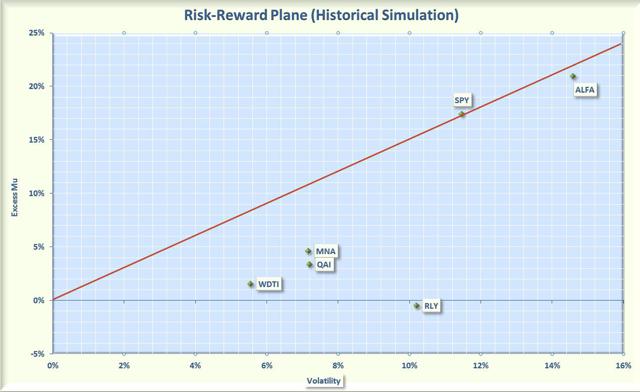
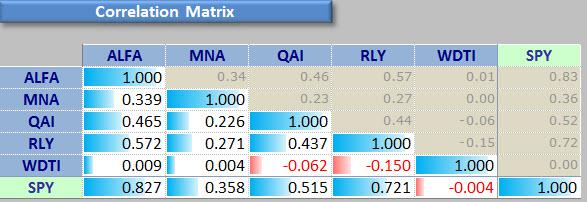
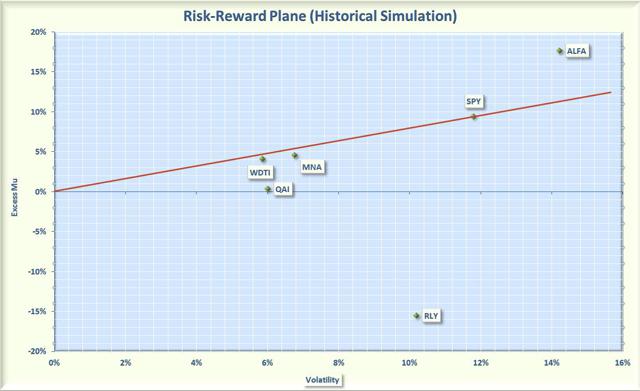 Summary Hedge fund ETFs provide a convenient way for retail investors to gain exposure to hedge fund strategies. Some, but not all, hedge fund ETFs were relatively uncorrelated with the S&P 500. Hedge fund ETF performances have been uneven, with some funds outperforming while others lagged. Hedge funds offer investors an alternative to traditional investment funds. Hedge funds can use leverage to increase returns and can also invest in a wide range of derivatives and short positions. Over the years some have scored phenomenal successes while others have suffered spectacular losses. Hedge funds are not currently regulated by the Securities and Exchange Commission (SEC) so only “accredited investors” can participate. Accredited investors must have a net worth of at least a million dollars or an income greater than $200,000 a year. Even if you meet the financial requirements, most funds charge a 2% management fee plus take 20% of the profits. These high charges are not for me so I looked for some alternatives to hedge funds among the plethora of Exchange Traded Funds (ETFs). The hedge fund ETF category includes funds with a variety of strategies including convertible arbitrage, managed futures, merger arbitrage, and tend following. Note that the ETFs in this category do not actually invest in hedge funds but instead try to replicate hedge fund performance. There are currently 22 ETFs in the hedge fund category but only five have assets over $100 million. These larger ETFs are summarized below. IQ Hedge Multi-Strategy Tracker ETF (NYSEARCA: QAI ). This ETF is based on techniques called “hedge fund replication” that try to reproduce hedge fund returns using a portfolio of conventional assets. The fund goes long or short other ETFs in an attempt to replicate the risk-adjusted performance of a mix of hedge funds. QAI uses a rules based momentum strategy to decide which assets to buy or short. The portfolio can change monthly depending on the economic environment but generally this fund maintains a large net long allocation to bonds, which can be rotated among Treasuries, corporate bonds, floating rates, high yield, and convertible bonds. The fund also invests in equities, currencies, commodities, and REITs. The effective duration of the bond portion of the portfolio is a little over 4 years. The fund has an expense ratio of 0.91% and yields 1.3%. This is the largest hedge fund ETF with an asset base of over $1 billion and a daily average volume of more than 180,000 shares. IQ ARB Merger Arbitrage ETF (NYSEARCA: MNA ). This ETF invests in global companies where there has been an announcement of an imminent merger or takeover. Merger arbitrage attempts to capture the difference between the current price of the takeover target and the final price. This is a market neutral strategy that has typically been relatively low risk. The fund currently has 58 holdings with 45% in US stocks, 15% in non-US stocks, and 40% in cash. The expense ratio is 0.76% and the fund does not generate any yield. The daily volume averages only 23,000 shares so limit orders should be used when buying or selling this fund. WisdomTree Managed Futures Strategy ETF (NYSEARCA: WDTI ). This actively managed WisdomTree ETF provides returns based on the Diversified Trend Indicator (DTI). DTI is a trend following, quantitative strategy developed by Victor Sperandeo (also known as “Trader Vic”). The DTI is used to go long or short futures associated with 24 components in 18 sectors. The futures cover a wide range of the liquid future markets including currencies (50%), energy (19%), livestock (5%), precious metals (5%), industrial metals (5%), and agriculture (16%). The fund is rebalanced monthly. The expense ratio is 0.95% and the fund does not have any yield. The daily volume averages only 34,000 shares per day so limit orders should be used when buying or selling this fund. AlphaClone Alternative Alpha ETF (NYSEARCA: ALFA ). This ETF invest in the securities that are widely held by hedge funds and institutional investors. This strategy is possible because hedge funds that manage more than $100 million must periodically disclose their equity holdings. The selection of the securities is based on a proprietary index methodology. The portfolio is also risk-managed and can vary from long-only to a heavily hedged position. The portfolio currently consists of 74 holdings with 83% from the US and 17% international. The sector breakdown includes 24% technology, 20% health care, 14% consumer staples, and 14% industrials. The expense ratio is 0.95% and the fund yields less than 1%. The daily volume averages only 22,000 shares so limit orders should be used when buying or selling this fund. SPDR Multi Asset Allocation ETF (NYSEARCA: RLY ). This is an actively managed ETF that is focused on securities that traditionally provide good inflation hedges. The portfolio consists of 12 ETFs, with a focus on inflation-linked bonds (19%), commodities (17%), REITs (20%), and natural resource companies (38%). The fund has an expense ratio of 0.70% and yields 2.3%. The daily volume is extremely small with an averages of only 5,000 shares so limit orders should be used when buying or selling this fund. For reference I also included the following funds in the analysis: SPDR S&P 500 Trust ETF (NYSEARCA: SPY ). This ETF tracks the S&P 500 index and has an ultra-low expense ratio of 0.09%. It yields 1.9%. SPY will be used to compare the performance of the hedge fund ETFs to the broad stock market. To assess the performance of the hedge fund ETFs, I plotted the annualized rate of return in excess of the risk free rate (called Excess Mu in the charts) versus the volatility for each of the funds. I used 1% as an estimate for the risk-free rate. I would have liked to see how these ETFs performed during the 2008 bear market but the oldest fund was not launched until 2009. Most of the other funds only have a 3 year history so I used a 3 year look-back period from June, 2012 to June, 2015. The Smartfolio 3 program was used to generate the plot shown in Figure 1. (click to enlarge) Figure 1. Risk versus reward over past 3 years Figure 1 illustrates that the hedge fund ETFs have had a large range of returns and volatilities. To better assess the relative performance of these funds, I calculated the Sharpe Ratio. The Sharpe Ratio is a metric, developed by Nobel laureate William Sharpe that measures risk-adjusted performance. It is calculated as the ratio of the excess return over the volatility. This reward-to-risk ratio (assuming that risk is measured by volatility) is a good way to compare peers to assess if higher returns are due to superior investment performance or from taking additional risk. In Figure 1, I plotted a red line that represents the Sharpe Ratio associated with SPY. If an asset is above the line, it has a higher Sharpe Ratio than SPY. Conversely, if an asset is below the line, the reward-to-risk is worse than SPY. Some interesting observations are evident from the figure. With the exception of ALFA, these funds were significantly less volatile than the S&P 500. However, this decrease in volatility was accompanied by an even larger decrease in return. Therefore, with the exception of ALFA, SPY easily outperformed these hedge funds on a risk-adjusted basis. ALFA was the best performer among all the hedge fund ETFs (on both an absolute and risk-adjusted basis). This is not too surprising since piggybacking on the equity portfolio of hedge funds would be expected to perform well in a bull market. However, ALFA was very volatile and slightly under-performed SPY on a risk-adjusted basis. RLY was the worst performer. Again, this was not surprising since inflation has been tame and precious metals have been in a bear market. WDTI had the lowest volatility but also a relatively low return that only beat RLY. Even though MNA and QAI employed different strategies, they booked similar risk-adjusted returns. One of the advertised advantages of hedge funds is the low correlation with the stock market. To assess the validity of this claim, I calculated the pair-wise correlations between the funds. The results are shown as a correlation matrix in Figure 2. The symbols for the funds are listed in the first column and along the top of the figure. The number at the intersection of the row and column is the correlation between the two assets. For example, if you follow WDTI to the right for two columns you will see that the intersection with MNA is 0.004. This indicates that, over the past 3 years, WDTI and MNA were only 0.4% correlated. Note that all assets are 100% correlated with themselves so the values along the diagonal of the matrix are all ones. Figure 2. Correlation matrix over past 3 years The figure illustrates that, with the exception of ALFA, hedge funds provide good diversification relative to the overall stock market. As you might expect, ALFA is highly correlated with SPY since the portfolio of ALFA consists of popular stocks from the S&P 500. The managed futures fund, WDTI, is basically uncorrelated with all the other funds so it provides excellent diversification. The other ETFs (MNA, QAI, and RLY) are only moderately correlated with each other and the stock market.. For my last analysis, I reduced the look-back period to 12 months. The results are shown in Figure 3. What a difference a couple of years make. During this period, both WDTI and MNA performed well and had essentially the same risk-adjusted return as the overall stock market. ALFA again was the best performer and actually beat out the S&P 500 on both an absolute and risk-adjusted basis. RLY as again the worst performer, sinking well below the zero line. (click to enlarge) Figure 3. Risk versus reward over past 12 months. Bottom Line Hedge fund ETFs cannot all be lumped together and some lived up to their hype while other did not. ALFA was by far the best performer but it is highly correlated with the S&P 500. If you are looking for a hedge against a stock market correction, I would not use ALFA. However, if you are risk tolerant and want exposure to the overall market, ALFA is worth consideration. As a hedge, I like WDTI and MNA. These are low volatility funds, have a reasonable return, and are relatively uncorrelated with the stock market. In a bull market, these funds will lag but I do think they have lived up to their reputation as a vehicle to hedge the market. Unfortunately, the most popular fund, QAI, has not lived up to its hype. RLY may do well in the future but until inflation increases, I would avoid this fund. Disclosure: I/we have no positions in any stocks mentioned, and no plans to initiate any positions within the next 72 hours. (More…) I wrote this article myself, and it expresses my own opinions. I am not receiving compensation for it (other than from Seeking Alpha). I have no business relationship with any company whose stock is mentioned in this article. Scalper1 News
Scalper1 News