Tag Archives: alt-investing

Greek Crisis Causes Market Volatility

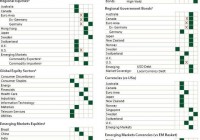
By Douglas R. Terry, CFA Jeff Snider and I often speak of the balance sheet leverage effect in markets. In the modern system, computer models assess the risk of portfolios throughout the industry. One key input to any value at risk model is volatility. If the standard deviation of prices rises, the computer will tell the managers that there is a greater probability of losses to the portfolio. Thus, managers have a mandate to reduce the risk in the portfolio to get their VAR back in down to acceptable levels. Thus, rising volatility is like a deleveraging type event as assets are sold. Many times the best performing assets in the portfolio are the ones that get chopped. This is partially because the out-performance likely means they are currently overweight in the portfolio, thus a rebalancing. Second, valuations of recent high flyers can be frothy compared to lagging peers. And third, assets with underlying strength can be easier to sell during market turmoil. Chinese equity weakness this past week was blamed on the Chinese economy. But I’m not convinced China shares were not merely the victim of recent success during a time of risk reduction. The table below shows some recommended changes in your asset allocation in order to reduce risk in your portfolio until the current Greek crisis is resolved and volatility comes back down. (click to enlarge) Disclosure : None

The Hardest Thing To Do In Investing

Summary The investment world is chocked full of pitfalls, missed opportunities, and unforeseen risks that make the game difficult under the best of circumstances. In my world, the hardest thing that I have to do on a regular basis is buying dips in the market. The best buying opportunities are usually the ones that feel the worst. The investment world is chocked full of pitfalls, missed opportunities, and unforeseen risks that make the game difficult under the best of circumstances. Many of us worry about high fees, perfect timing, macro headline risks, and security selection with a fervor that can only be described as obsessive. At this stage of the game many investors have now converted to the ETF model and know they are getting the lowest fees possible with heavy diversification. With any luck they have also weeded out their friend’s “stock tips” after a few bad trades. Yet, the endless worries over the Fed hiking interest rates, Greece defaulting, China’s bubble collapsing, and a variety of other cataclysmic headlines make it difficult to control our emotions. The endless cycles of fear and greed are powerful motivators that try to lure us into selling low or buying high with predictable outcomes. In my world, the hardest thing that I have to do on a regular basis is buying dips in the market. It’s uncomfortable every time that I have to do it and I literally have to swallow the lump in my stomach and force myself to push the button. Why? The best buying opportunities are usually the ones that feel the worst. Let’s face it, when the market is down 3, 5, or even 10%, it’s usually because something bad is happening in the world. A country with a stock market you barely knew existed is going bankrupt, a server glitch in some backroom closet is rearing its ugly head, or an unexpected black swan event has sent shockwaves of panic across the globe. If you’re like me, your initial reaction is probably to sell everything and stock up on canned goods and ammunition. But the reality is that drastic moves of this nature will likely cause more harm than good and it’s usually not the end of the world despite the media hype. Keeping a level head and balanced perspective of the market will serve you much better than immediately trying to clear the decks. Instead of taking a sledge hammer to your portfolio, I prefer to make subtle changes to reduce the overall risk profile or deploy cash in areas of the market that look attractive during a pullback. Reduce Risk Consider transitioning away from your 3x biotech ETF to a more conservative equity holding in order to ride out the storm. As an example, I recently sold an underperforming sector position and purchased the iShares MSCI USA Minimum Volatility ETF (NYSEARCA: USMV ) for my Strategic Income clients. This move allowed me to reposition my equity exposure into an index suited for the current market environment without drastically altering the overall portfolio mix. Evaluate your bond sleeve for any signs of undo stress. Credit sensitive holdings such as high yield bonds, emerging market bonds, and convertible bonds should be put under a microscope to determine if they are indeed adding value. You may even want to consider transitioning a portion of those holdings to a more diversified bond fund with a mix of quality and credit securities. I’m still a believer in the efficacy of active management in fixed-income, which makes the PIMCO Total Return ETF (NYSEARCA: BOND ) and SPDR DoubleLine Total Return Tactical ETF (NYSEARCA: TOTL ) two of my top options. More than likely, a falling stock market will trigger a flight to quality that helps counterbalance the risk of your remaining equity holdings. When all else fails, raise a modest amount of cash to put back to work in the market once the dust clears. That may include selling some of your most volatile positions and putting the money on the sidelines for a short period of time. However, be wary of holding too much cash for too long and letting opportunities pass you by – see the next section below for details. Deploy Cash The first step in your game plan to deploy cash is to develop a watch list of positions that you want to purchase. This should include evaluating holdings based on relative strength, costs, volatility, and in the context of holes in your existing asset allocation. Take note of leadership sectors and those that are more defensive-oriented. If you are positioning for a comeback, you want to put your money to work in areas that you feel will offer the best opportunity to outperform on the upside. Identify points both below and above the current price where it would make sense to start a new position. You may not get all the way to an intended low point in the market, so it’s important to have a game plan if stocks begin to head higher as well. Discipline is important here as you don’t want to get left behind during the next rally phase. Start small and deploy capital in incremental steps. Avoid trying to call a bottom with a significant portion of your money. You may want to average into a new position with two or three trades rather than going all in at once. This will allow you greater flexibility to control your cost basis and not over commit to a certain outcome. Transaction-free ETFs make this very easy and cost-effective to accomplish. In addition, most of the major online brokerage companies have a suite of them at your disposal. The Bottom Line Despite all the innovation in the last 100 years of the stock market, controlling emotions and buying into fear is one of the hardest things to do with your hard earned capital. While it may seem counterintuitive, lightening up on your exposure on long rallies and adding on dips will serve as a solid map to achieve successful results.
Adding XIV, Inverse Volatility ETF, Enhances The Performance Of A Stocks And Bonds Portfolio

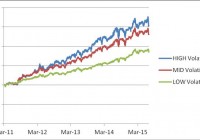
Summary A hypothetical portfolio composed of MDY, QQQ, SHY and TLT performed quite well since its inception in 2003, even during the bear market of 2008-09 and the 2011 market correction. Adding XIV to the portfolio increases the performance range significantly. The enhanced portfolio performed well during the 2011 market correction. In this article we investigate the effect of adding a volatility component to a portfolio of stock and bond ETFs that is known to perform well during market downtrends. We decided to add the VelocityShares Daily Inverse VIX Short-Term ETN (NASDAQ: XIV ), a fund initiated on 11/29/2010. Since XIV historical price data is available only from December 2010 on, and we need 65 trading days for estimating market parameters, we were able to simulate our optimal allocation strategy starting with March 2011. We performed an analysis of the difference in performance of the basic and enhanced portfolios over a 52 months period. Here is the composition of the volatility enhanced portfolio: SPDR S&P Mid-Cap 400 ETF Trust (NYSEARCA: MDY ) PowerShares QQQ Trust ETF (NASDAQ: QQQ ) iShares 1-3 Year Treasury Bond ETF (NYSEARCA: SHY ) iShares 20+ Year Treasury Bond ETF (NYSEARCA: TLT ) VelocityShares Daily Inverse VIX Short-Term ETN ( XIV ) Basic information about the funds was extracted from Yahoo Finance and is shown in table 1. Table 1. Symbol Inception Date Net Assets Yield Category MDY 5/4/1995 17.04B 1.08% Mid-Cap Blend QQQ 3/31/1999 45B 1.01% Technology Large-Cap SHY 7/22/2002 9.17B 0.42% Short Term Treasury Bond TLT 7/22/2002 17.04B 2.70% Long Term Treasury Bond XIV 11/29/2010 497M 0.00% Inverse Volatility The data for the study were downloaded from Yahoo Finance on the Historical Prices menu for MDY, QQQ, SHY, TLT, XIV. We use the daily price data adjusted for dividend payments. The portfolio is managed as dictated by a variance-return optimization algorithm developed on the Modern Portfolio Theory (Markowitz). The allocation is rebalanced monthly at market closing of the first trading day of the month. The optimization algorithm seeks to maximize the return under a constraint on the portfolio risk determined as the standard deviation of daily returns. In table 2 we list the total return, the compound average growth rate (CAGR%), the maximum drawdown (maxDD%), the annual volatility (VOL%), the Sharpe ratio and the Sortino ratio of the volatility enhanced portfolio. We simulated the performance of the portfolio under three targets of the volatility of the returns: low, mid and high. Table 2. Performance of the volatility enhanced portfolio from March 2010 to June 2015   TotRet CAGR NO.trades maxDD VOL Sharpe Sortino LOW risk 84.84% 15.26% 52 -6.90% 9.71% 1.57 2.04 MID risk 130.38% 21.28% 50 -9.83% 13.93% 1.53 2.03 HIGH risk 152.63% 23.89% 50 -12.56% 17.06% 1.40 1.82 SPY 71.93% 13.35% 0 -18.61% 15.15% 0.88 1.11 In figure 1 we show the equity curves for the portfolio with the three targets of the volatility. (click to enlarge) Figure 1. Equity curves for the volatility enhanced portfolio adaptively optimized with a low, mid, and high volatility constraint. Source: This chart is based on calculations using the adjusted daily closing share prices of securities. We also simulated the optimal allocation for maximizing the return without any volatility constraints. The results for the basic portfolio (MDY+QQQ+SHY+TLT) and the volatility enhanced portfolio (same ETFs + XIV), are shown in table 3. Table 3. Performance of portfolios optimized for maximum return without volatility constraints.   TotRet CAGR NO.trades maxDD VOL Sharpe Sortino Basic 113.00% 19.10% 16 -13.83% 15.10% 1.27 1.84 Enhanced 462.22% 49.06% 15 -39.00% 46.53% 1.05 1.22 The equity curves of the portfolios are shown in figure 2. (click to enlarge) Figure 2. Equity curves for the basic and the volatility enhanced portfolio optimized for maximum return without any volatility constraints. Source: This chart is based on calculations using the adjusted daily closing share prices of securities. As can be seen from table 3 and figure 2, the enhanced portfolio can achieve extremely high returns. Those high returns come with a high increase of the volatility of the returns. This behavior is not surprising, given the high volatility of the XIV fund. Fortunately, the XIV fund accumulates gains due to its daily rebalancing while the VIX futures are in contango because it buys the cheaper current month VIX future and it sells the more expensive next month VIX future. Of course, the rebalancing causes losses while the VIX futures are in backwardation. We compared the returns of the portfolios over the bear market of 2008, and the market corrections of 2010 and 2011. The results are shown in table 4. Table 4 Total returns of the portfolios during market downturns Time Period SPY Basic Port. Enhanced Port. 4/2011 – 9/2011 -16.22% 15.09% 11.12% As seen in table 4 both the basic and the enhanced portfolios were profitable during the 2011 market correction. We know that the basic portfolio was profitable during the 2008-09 bear market. We expect that the enhanced portfolio would also perform well, but we do not have historical data to verify it. Conclusion By adding a volatility based fund to a portfolio of stock and bond funds, we obtained a portfolio that is capable of delivering exceptionally high returns during stock bull markets. By allocating the funds based on a return-variance optimization algorithm with volatility constraints, one can achieve high returns with limited down risk during market corrections. Additional disclosure: The article was written for educational purposes and should not be considered as specific investment advice. Disclosure: I am/we are long QQQ,SHY. (More…) I wrote this article myself, and it expresses my own opinions. I am not receiving compensation for it (other than from Seeking Alpha). I have no business relationship with any company whose stock is mentioned in this article.