Tag Archives: alt-investing

How To Avoid The Worst Style ETFs: Q2’15 In Review
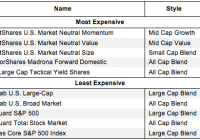
Summary The large number of ETFs has little to do with serving your best interests. Below are three red flags you can use to avoid the worst ETFs. The following presents the least and most expensive style ETFs as well as the worst overall style ETFs per our 2Q15 sector ratings. Question: Why are there so many ETFs? Answer: ETF providers tend to make lots of money on each ETF so they create more products to sell. The large number of ETFs has little to do with serving your best interests. Below are three red flags you can use to avoid the worst ETFs: 1. Inadequate Liquidity This issue is the easiest to avoid, and our advice is simple. Avoid all ETFs with less than $100 million in assets. Low levels of liquidity can lead to a discrepancy between the price of the ETF and the underlying value of the securities it holds. Plus, low asset levels tend to mean lower volume in the ETF and larger bid-ask spreads. 2. High Fees ETFs should be cheap, but not all of them are. The first step here is to know what is cheap and expensive. To ensure you are paying at or below average fees, invest only in ETFs with total annual costs below 0.49%, which is the average total annual cost of the 289 U.S. equity Style ETFs we cover. Figure 1 shows the most and least expensive Style ETFs. QuantShares provides three of the most expensive ETFs while Schwab ETFs are among the cheapest. Figure 1: 5 Least and Most-Expensive Style ETFs Sources: New Constructs, LLC and company filings Investors need not pay high fees for quality holdings. Arrow QVM Equity Factor (NYSEARCA: QVM ) earns our Very Attractive rating and has low total annual costs of only 0.72%. On the other hand, no matter how cheap an ETF, if it holds bad stocks, its performance will be bad. The quality of an ETFs holdings matters more than its price. 3. Poor Holdings Avoiding poor holdings is by far the hardest part of avoiding bad ETFs, but it is also the most important because an ETF’s performance is determined more by its holdings than its costs. Figure 2 shows the ETFs within each style with the worst holdings or portfolio management ratings . Figure 2: Style ETFs with the Worst Holding Sources: New Constructs, LLC and company filings State Street, iShares, and PowerShares appear more often than any other providers in Figure 2, which means that they offer the most ETFs with the worst holdings. Our overall ratings on ETFs are based primarily on our stock ratings of their holdings. The Danger Within Buying an ETF without analyzing its holdings is like buying a stock without analyzing its business and finances. Put another way, research on ETF holdings is necessary due diligence because an ETF’s performance is only as good as its holdings’ performance. PERFORMANCE OF ETF’s HOLDINGS = PERFORMANCE OF ETF Disclosure: David Trainer and Max Lee receive no compensation to write about any specific stock, style, or theme. Disclosure: I/we have no positions in any stocks mentioned, and no plans to initiate any positions within the next 72 hours. (More…) I wrote this article myself, and it expresses my own opinions. I am not receiving compensation for it. I have no business relationship with any company whose stock is mentioned in this article.
Volatility Decays Without The Roll

“Roll Yield” is a frequently spoken about but lesser understood phenomenom. Volatility futures decay without the roll. Continue to short volatility for excellent long-run gains. Roll decay is a term that is commonly thrown around when discussing futures. It is an easily observable phenomenon in commodities markets that results from a positively sloping forward curve. When an electronically-traded-product “rolls” contracts along such a curve, it sells near-term futures and uses the proceeds to buy further-out futures. In rolling, the net value of the fund has not changed. Maybe 12 near-term contracts valued at $10 each were sold for 10 further-out $12 contracts. The gross value is $120 immediately before the transaction and $120 immediately after the transaction. There is no decay in asset value. The decay happens afterwards…sometimes. In the example above, both contracts were priced above the spot rate, and the further-out contract was priced above the near-term. If the underlying asset is a random walk, then on average (long-term average), the moving average of the spot will be equal to the current spot. In other words, the expected return on carry is 0. So both futures will need to drift down, and the further-out future will need to drift down more. In the real world, most assets are not a random walk. They tend to drift themselves. If they are positively correlated with the market, they tend to drift upwards; and vice versa. In commodities and equities markets, this drift is fairly deterministic in the long-run and becomes implicit in the term structure. Therefore the “roll” decay is, in fact, a result of rolling less-overpriced contracts into more-overpriced contracts. The VIX is very different. It’s not a random walk. It’s a random spring. It makes a lot of noise but its long-run moving average is very predictable. When the VIX spot is $12 and the first month future is $14, the empirically derived mathematical expectation of the first future isn’t to converge to $12. Instead it is to converge to something like $13, as the spot springs from $12 back toward its center and hits $13 along the way. Likewise when the VIX spot is $30 and the first month future is $26, a long position on the first month future still decays (on average) because the spot drops down to something like $25 on average. Please see this article for elaboration: The take away is that the slope of the volatility forward curve is of little to no consequence. ETN’s like TVIX, VXX, and VXZ will continue to decay so long as they are tied to VIX futures that are themselves individually overpriced (in comparison to their mathematical/statistical expectations.) For something like the VXX, the “roll” decay occurs because it is in constant possession of two futures contracts (M1 and M2), that are in an almost perpetual state of being over-priced. The allocations are irrelevant. If VXX stopped rolling contracts, any static mix of M1 and M2 would show similar performance on average. Volatility futures decay standing still. So unless you have a crystal ball or an uncanny ability to predict the future, betting against volatility futures continues to be highly advisable. There will be plenty of noise short-term, but long-term bets will reap in the green. And plea se see the following article if you would like to drown-out some of the noise: Disclosure: I/we have no positions in any stocks mentioned, and no plans to initiate any positions within the next 72 hours. (More…) I wrote this article myself, and it expresses my own opinions. I am not receiving compensation for it (other than from Seeking Alpha). I have no business relationship with any company whose stock is mentioned in this article. Additional disclosure: I am short volatility futures.

F.U.D. And Dividend Shock Absorbers

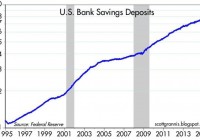
As the existential question remains open on whether Greece will remain a functioning entity within the eurozone, investor anxiety and manic behavior continues to be the norm. Rampant fear seems very counterintuitive for a stock market that has more than tripled in value from early 2009 with the S&P 500 index only sitting -3% below all-time record highs. Common sense would dictate that euphoric investor appetites have contributed to years of new record highs in the U.S. stock market, but that isn’t the case now. Rather, the enormous appreciation experienced in recent years can be better explained by the trillions of dollars directed towards buoyant share buybacks and mergers. With a bull market still briskly running into its sixth year, where can we find the evidence for all this anxiety? Well, if you don’t believe all the nail biting concerns you hear from friends, family members, and co-workers about a Grexit (Greek exit from the euro), Chinese stock market bubble, Puerto Rico collapse, and/or impending Fed rate hike, then here are a few confirming data points. For starters, let’s take a look at the record $8 trillion of cash being stuffed under the mattress at near 0% rates in savings deposits ( see chart below ). The unbelievable 15% annual growth rate in cash hoarding since the turn of the century is even scarier once you consider the massive value destruction from the eroding impact of inflation and the colossal opportunity costs lost from gains and yields in alternative investments . (click to enlarge) Next, you can witness the irrational risk averse behavior of investors piling into low ( and negative ) yielding bonds. Case in point are the 10-year yields in developing countries like Germany, Japan, and the U.S. ( see chart below ). (click to enlarge) The 25-year downward trend in rates is a very scary development for yield-hungry investors. The picture doesn’t look much prettier once you realize the compensation for holding a 30-year bond (currently +3.2%) is only +0.8% more than holding the same Treasury bond for 10 years (now +2.4%). Yes, it is true that sluggish global growth and tame inflation is keeping a lid on interest rates, but these trends highlight once again that F.U.D. (fear, uncertainty, and doubt) has more to do with the perceived flight to safety and high bond prices (low bond yields). In addition, the -$57 billion in outflows out of U.S. equity funds this year is further evidence that F.U.D. is out in full force. As I’ve noted on repeated occasions, when the tide turns on a sustained multi-year basis and investors dive head first into stocks, this will be proof that the bull market is long in the tooth and conservatism should be the default posture. There are always plenty of scary headlines that tempt investors to bail out of their investments. Today those alarming headlines span from Greece and China to Puerto Rico and the Federal Reserve. When the winds of fear, uncertainty, and doubt are fiercely swirling, it’s important to remember that any investment strategy should be constructed in a diversified manner that meshes with your time horizon and risk tolerance. Consistent with maintaining a diversified portfolio, owning reliable dividend paying stocks is an important component of investment strategy, especially during volatile periods like we are experiencing currently. Sure, I still love to own high octane, non-dividend growth stocks in my personal and client portfolios, but owning stocks with a healthy stream of dividends serve as shock absorbers in bumpy markets with periodic surprise potholes. As I’ve note before, bond issuers don’t call up investors and raise periodic coupon payments out of the kindness of their hearts, but stock issuers can and do raise dividends (see chart below). Most people don’t realize it, but over the last 100 years, dividends have accounted for approximately 40% of stocks’ total return as measured by the S&P 500. (click to enlarge) Source: BuyUpside.com Markets will continue to move up and down on the news du jour, but dividends overall remain fairly steady. In the worst financial crisis in a generation, dividends dipped temporarily, but as I explain in a previous article ( The Gift that Keeps on Giving ), dividends have been on a fairly consistent 6% growth trajectory over the last two decades. With corporate dividend payout ratios well below long term historical averages of 50%, companies still have plenty of room to maintain (and grow) dividends – even if the economy and corporate profits slow. Don’t succumb to all the F.U.D., and if you feel yourself beginning to fall into that trap, re-evaluate your portfolio to make sure your diversified portfolio has some shock absorbers in the form of dividend paying stocks. That way your portfolio can handle those unexpected financial potholes that repeatedly pop up. DISCLOSURE: Sidoxia Capital Management (SCM) and some of its clients hold positions in certain exchange traded funds (ETFs) and SPY, but at the time of publishing, SCM had no direct position in any other security referenced in this article. No information accessed through the Investing Caffeine (IC) website constitutes investment, financial, legal, tax or other advice nor is to be relied on in making an investment or other decision. Please read disclosure language on IC Contact page .