Scalper1 News
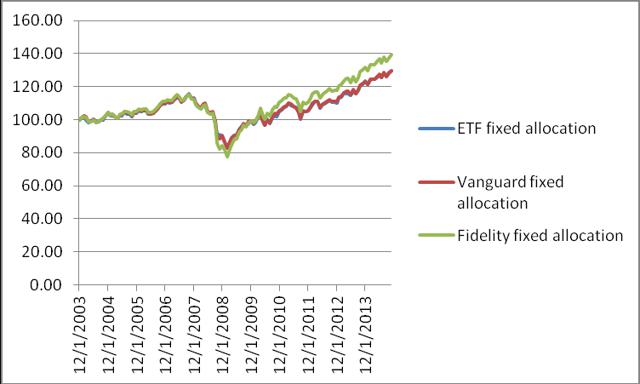
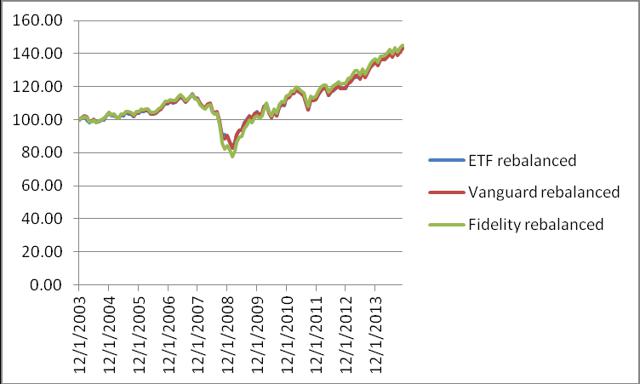
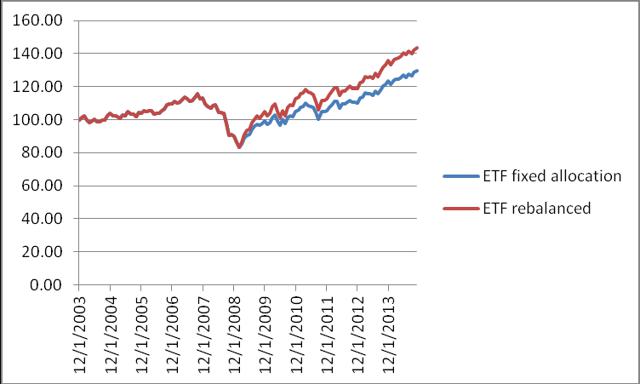
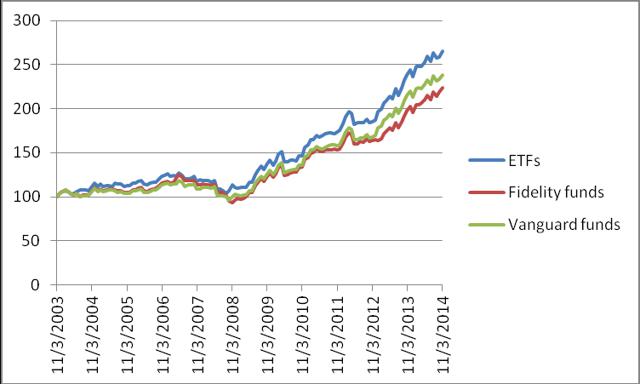
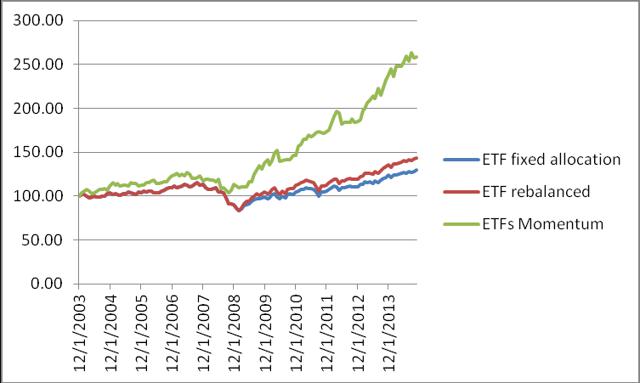 Summary Robust investment portfolios can be constructed with just two ETFs: one representing the total stock market and another representing the total bond market. From November 2003 to December 2014, the ETF portfolio with fixed allocation allowed a safe 4% annual withdrawal rate and achieved a 28.95% increase of the capital. Better returns were achieved by rebalancing the portfolio at 25% deviation from the target weights. Capital increased by 43.66%, average annual return of 3.35%. Radically better performance is achievable using adaptive asset allocation. With a safe 4% withdrawal rate, the capital increased by 164.93%, average annual return of 9.26%. ETF portfolio performs essentially the same as its mutual fund counterparts. The comparison of their performance is evident in the tables included in the article. In a couple of recent articles , we demonstrated that a very simple and well diversified portfolio may be made up of two instruments, one representing the total stock market, and the other the total bond market. These portfolios are quite robust and achieve decent returns using simple strategies as rebalancing and momentum based adaptive allocation. At the suggestion of some readers, we investigate the suitability of these portfolios as retirement investments for income generation and capital appreciation. From many possibilities, I selected the following three portfolios: one built with iShares and Vanguard ETFs, the second with Vanguard mutual funds, and the third with Fidelity mutual funds. ETFs portfolio: iShares Core US Aggregate Bond Market ETF (NYSEARCA: AGG ) and Vanguard Total Stock Market ETF (NYSEARCA: VTI ). Mutual funds portfolio: Vanguard Total Bond Market Index Fund (MUTF: VBMFX ) and Vanguard Total Stock Market Index Fund (MUTF: VTSMX ). Mutual funds portfolio: Fidelity Total Bond Market Index Fund (MUTF: FTBFX ) and Fidelity Spartan Total Stock Market Index Fund (MUTF: FSTMX ). For purposes of comparison we simulate these portfolios from November 2003 to December 2014, a total of eleven years. The time period of the study was selected based on the availability of historical data of the investment instruments; AGG was created in September 2003. In this article, three different strategies will be considered: Portfolio is 50% stocks and 50% bonds without rebalancing. Portfolio is created with 50% stocks and 50% bonds; it is rebalanced when the allocation deviates by 25% from the 50 target, when the allocations become 62.5% and 37.5%. Portfolio is at all times invested 100% in either stocks, or bonds. The switching, if necessary, is done monthly at closing of the last trading day of the month. All the funds are invested in the instrument with the highest return over the previous 3 months. The data for the study were downloaded from Yahoo Finance on the Historical Prices menu for the six tickers. We use the monthly price data from September 2003 to November 2014, adjusted for stock splits and dividend payments. The time selection is restricted by the availability of data; AGG was created in September 2003. Portfolios with fixed weights with withdrawals, no rebalancing Assume that we have $1,000,000 to invest for income in retirement. We plan to withdraw 4% annually plus a 2% inflation adjustment. The withdrawals are done monthly. Over the 11 years from 2003 to 2014, a total of $488,000 was withdrawn. The first table shows the results of the portfolios created with 50% AGG and 50% VTI, and their Vanguard and Fidelity mutual fund counterparts. The monthly withdrawal is done such a way that the weights of the two components are brought back toward the target of 50-50. Below, we show the hypothetical behavior of these equal weight portfolios from November 2003 to December 2014. The maximum drawdowns of the portfolios are larger than that of the same portfolios without income withdrawals, because the withdrawals decrease the equity. On the average the returns are greater than the withdrawals, so the total capital is increasing . The CAGR columns give the cumulative average growth rate of the capital. Table 1. Fixed allocation portfolios without rebalancing CAGR% Max DD % Final Equity AGG + VTI 2.40 -28.29 1,298,500 VTSMX + VBMFX 2.40 -28.34 1,298,100 FSTMX + FTBFX 3.05 -32.75 1,392,100 The plots of the portfolios are shown in figure 1. The values are shown in percentages of the initial investment. (click to enlarge) Figure 1. Equities of portfolios with 4% annual withdrawal without rebalancing. Source: This chart is based on EXCEL calculations using the adjusted monthly closing share prices of securities. Portfolios with fixed weights with withdrawals and rebalancing As before, we assume that we have $1,000,000 to invest for income in retirement. We plan to withdraw 4% annually plus a 2% inflation adjustment. Over the 11 years from 2003 to 2014, a total of $488,000 was withdrawn. The only difference of the strategy is that we rebalance the portfolio when the allocation between stocks and bonds deviates by 25% from the 50% target. The rebalance happens when the allocations become 62.5% and 37.5%. During the 11 years of our study there was only one rebalancing. But, as can be seen in Table 2, the rebalance contribute to a substantial increase in returns. Table 2. Fixed allocation portfolios with rebalancing CAGR% Max DD % Final Equity AGG + VTI 3.35 -28.29 1,436,600 VTSMX + VBMFX 3.31 -28.34 1,430,800 FSTMX + FTBFX 3.45 -32.75 1,451,700 The plots of the portfolios are shown in figure 2. The values are shown in percentages of the initial investment. (click to enlarge) Figure 2. Equities of portfolios with 4% annual withdrawal and rebalancing. Source: This chart is based on EXCEL calculations using the adjusted monthly closing share prices of securities. To appreciate the improvement obtained by rebalancing, in figure 3 are shown the equities for the ETF portfolio with and without rebalancing. (click to enlarge) Figure 3. ETF portfolios with fixed allocations Source: This chart is based on EXCEL calculations using the adjusted monthly closing share prices of securities. Adaptive Asset Allocation What we presented so far is a robust example from which one can infer that portfolio rebalancing has some positive effect in improving returns of a retirement investment. Another approach, with significant better results is to apply an adaptive asset allocation based on price momentum. We consider again the ETF portfolio of VTI and AGG by switching between two allocations: 100% AGG and 0% VTI 0% AGG and 100% VTI The switching is done monthly, on the last trading day of the month, using the following rule: invest fully in the asset with the highest return during the most recent 3 months. From November 2003 to November 2014, there were 25 reallocations of the ETF portfolio. The system was invested 88 months in VTI, and 44 months in AGG. The adaptive allocation system based on momentum achieved much higher return and lower drawdown than the fixed allocation system with or without rebalancing. Similar results were obtained with the Vanguard and Fidelity mutual funds. Those portfolios required 27 reallocations during the 11 years of the study. The Vanguard portfolio was invested 87 months in VTSMX, and 45 months in VBMFX. The Fidelity portfolio was invested 87 months in FSTMX, and 45 months in FTBFX. Table 3. Adaptive allocation portfolios CAGR% Max DD % Final Equity AGG + VTI 9.26 -18.18 2,649,300 VTSMX + VBMFX 8.22 -18.67 2,384,300 FSTMX + FTBFX 7.61 -24.97 2,241,700 The plots of the portfolios are shown in figure 1. The values are shown in percentages of the initial investment. (click to enlarge) Figure 4. Adaptive Allocation Portfolios Source: This chart is based on EXCEL calculations using the adjusted monthly closing share prices of securities. Conclusion The adaptive allocation algorithm performed substantially better than the fixed allocation algorithms regardless of the type of market. It generated much higher returns with lower risk. For a comparison see figure 5. (click to enlarge) Figure 5. ETF portfolios with monthly withdrawals 2003-2011. Source: This chart is based on EXCEL calculations using the adjusted monthly closing share prices of securities. Scalper1 News
Scalper1 News