Scalper1 News
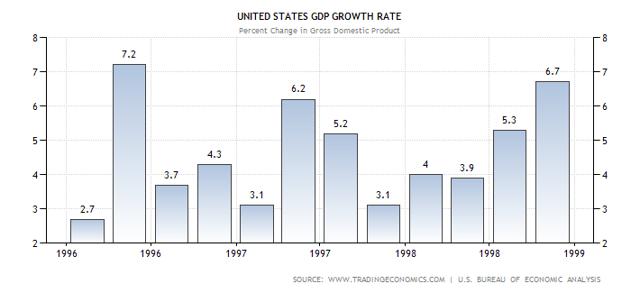
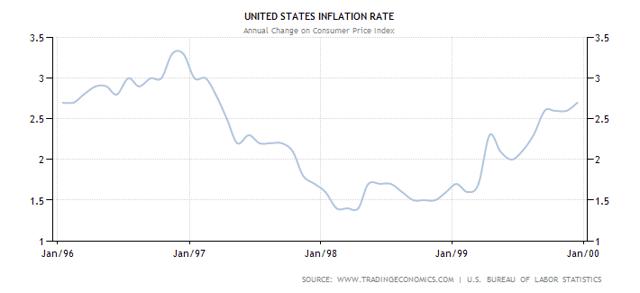
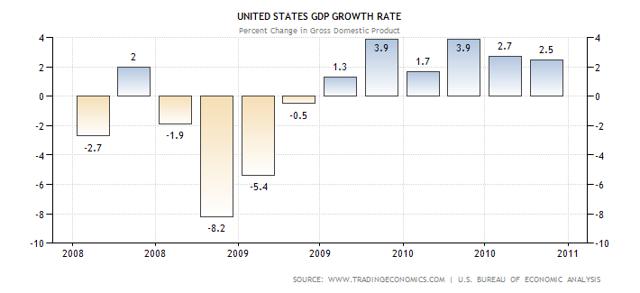
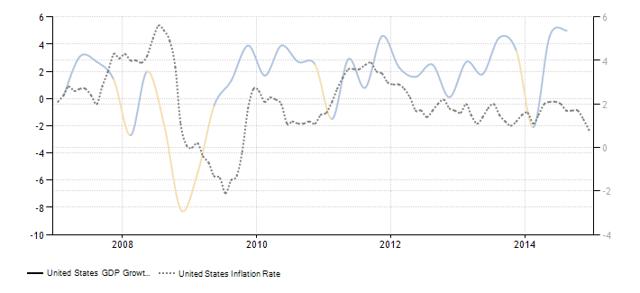
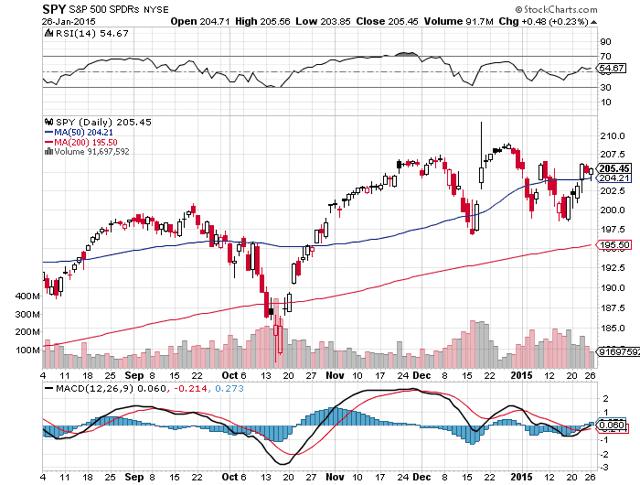 Richmond Fed President Lacker has reminded us of the U.S. recovery in 1997 and 2003 in the face of overwhelming Asian economic troubles. The lesson of the Asian Financial Crisis is briefly recapped with the actual impact on U.S. growth and inflation shown. After the U.S. recovered in 2010, it is European Sovereign Debt Crisis which darken the economic cloud but this shouldn’t derail us from the bigger economic picture. SPY with its collection of big chip companies like AAPL and XOM would be an excellent vehicle to ride the U.S. recovery. SPY has paused in its price range as European woes prevent its raise but this should not be the case for long. Potential catalyst for SPY is stated. I quote the following from Richmond Federal Reserve President Jeffrey M. Lacker during his speech earlier this month to the Virginia Bankers Association and Virginia Chamber of Commerce. The economic outlook can change rapidly, and judgments about appropriate policy need to respond accordingly. It’s not hard to find historical examples: The outlook for real activity shifted dramatically from late 1998, when overseas turmoil was thought to jeopardize U.S. growth, to early 1999, when it became clear that the effects would be minimal and activity was accelerating. Similarly, the outlook for growth and inflation shifted significantly from mid-2003, when inflation seemed to be sinking below 1 percent, to early 2004, when growth and inflation were clearly rising. Arguably, the Fed fell at least somewhat behind the curve in each case. President Lacker provided a very good example of the recency bias where people tend to focus on the recent events to the extent where they are too absorbed to look into the future. The 1997 Asian Financial Crisis and the 2003 SARS health crisis hit Asia which resulted in concerns over growth in the United States which were blown out of proportion. There are draw parallels with the economic situation today if we replace Asia with Europe as the economic source that is dragging down the U.S. It would be instructive to look at the actual economic growth and inflation in the U.S. during this period. This is the best example for the Fed’s insistence that low energy prices are transitory in nature and the need to see the bigger picture and to get ahead of the curve. 1997 Asian Financial Crisis The 1997 Asian Financial Crisis started in Thailand where speculators were successful in pushing down the value of the Thai baht to the point where it became virtually worthless. Other Asian countries follow suit to devalue their currencies to protect their vulnerable export sector with the notable exception of Malaysia which implemented currency control. Hot capital flows fled Asia and growth in the U.S. was negatively impacted as seen in the chart below before and after the crisis. (click to enlarge) If we were to look at these growth numbers with today’s eyes, it will look like a pretty solid growth trajectory to us. Then again, we have to remember that this is 2 decades ago where the U.S. is still the engine of growth globally and China was just emerging as the manufacturing hub with its low labor cost. The IMF intervention in July 1997 for Thailand marks the beginning of a serious crisis and we saw growth in the U.S. dropped from 6.2% in the second quarter of 1997 to 5.2% in the third quarter and 3.1% in the fourth quarter of 1997. As a sign of the emergencies of the times, Indonesia had to asked the IMF and World Bank for help in October 1997 after its rupiah dropped by 30% in 2 months (which puts the 1 day 40% CHF decline in perspective after the surprise SNB decision to abandon the EURCHF 1.2 floor on 15 January 2015.) and by January 1998 Indonesians were stockpiling necessities. In May 1998, President Suharto had to resign after 32 years in power due to widespread public discontent with riots on the streets. This was the beginning of serious concerns over a widespread financial crisis engulfing the U.S. and the world. However on hindsight, it was exaggerated as the real impact of the Asian Financial Crisis never really reached the shores of the U.S. in the manner which it affected South Korea, Thailand, Indonesia and Russia. (click to enlarge) Inflation dropped drastically between 1997 and 1998 as the crisis heats up from 3.25% to less than 1.5% within a year. The Fed responded by cutting interest rates by 0.25% on October and November 1998 and by then at the end of 1998, the crisis has largely passed. The Fed went on to reverse its rate cut decision in 1998 by increasing it by 0.25% each in August and November 1999 back to 5%. So the crisis of 1997 shows that the impact can come quickly and it passed quickly. By the time, the worst of the crisis was exaggerated and reported in the market, the crisis has passed and growth had returned. Current Situation The difference between 1997 and the 2007 Credit Crunch that led to the Great Recession of 2008 and 2009 is that they had their source in the housing bubble in the United States. This lead to a longer recovery period but we can see from the chart below that growth has returned in 2010 after the contraction of 2008 and 2009. (click to enlarge) Also the difference between then and now is that after the U.S. recovered in 2010, it is Europe’s turn to get into trouble with their sovereign debt crisis. In contrast, Asia was able to recover relatively quickly after the crisis with a V shape recovery from 1999. This is why the current U.S. recovery took a longer period of time and at such a low rate of economic recovery. However we must acknowledged that enough time has passed and there has been substantial improvement for the U.S. economy. (click to enlarge) We can see in the overlay of GDP growth (listed on the left hand side) and inflation (on the right side). GDP growth has hit 5% in the third quarter of 2014 and this is an 11 year high. On 30 January 2015, we will see the advance estimate for the fourth quarter of 2014 and it is expected to come in strongly at 3.0%. Overall growth for year 2014 should be between 2.5% and 3%. This is a strong economic growth and the U.S. is the only major developed economy to hit this growth rate. The only difference is that the inflation rate has divergence and gone down. There are some pundits that will see this as signs of future economic weakness due to weakening of global demand. This is unlikely to be case as we know that this is due to increase supply of oil from the U.S. due to advances in technology and the unwillingness of OPEC to reduce their output of oil. Benefiting From U.S. Growth The way which investors can benefit from a strong and sustained U.S. growth is to gain exposure to a diversified portfolio of U.S. stocks by the way of the SPDR S&P 500 Trust ETF (NYSEARCA: SPY ). SPY gathers the best companies in the U.S. which are likely to receive the bulk of the increased expenditure when the U.S. recovery gathers steam. Think of company like Apple (NASDAQ: AAPL ) which is the top company in this ETF with 3.54%. AAPL is the company you think of when you want to purchase a new phone or laptop. The next on the list is Exxon Mobil (NYSE: XOM ) with 2.14% of the ETF. XOM has both upstream and downstream activities and its greatest brand for the public is probably the petrol pump of Mobil. While XOM will be pressured during this period of the low energy prices, we can be sure that it is here for the long run and will benefit when smaller competitors are chased out of the market. I could go on but the point is that SPY contains the blue chip companies of the U.S. and you can’t go wrong with it. Its growth might be lesser than if you picked the next Google but you have lesser chance of losing money on a mistake and this is where you should park the bulk of your wealth. SPY is heavily tilted towards technology companies with 17.89% weighting, financial services at 15.25%, healthcare at 14.71%, industrials at 11.18% and consumer cyclical at 10.59% to round up the top 5. Its price is also reasonable at 17 times earnings. (click to enlarge) We can see that after dip of ‘the buy and go away’ month of October, we have seen strong growth in the SPY in November. From December onward to this month, SPY has been in a range of $197 to $210. This represents market worry about the European contagion. As we have seen in the Asian Financial Crisis which the Richmond Fed President has kindly reminded us, this is likely to be overblown in the media. The U.S. recovery has started since 2010 and it has already been 4 years. It has withstood criticism of the quality of the recovery and the tapering of the Fed’s QE which is thought to artificially inflate the equity market. After the Fed formally ended QE3 in October 2014, there was some pullback in the equity market (also due to investor psychology and also bearish articles such as this Forbes article urging readers to stay in Cash.) but it has largely corrected itself. There will always be negative news in the market and we should look beyond them to the bigger picture and trend that has built up over time. The U.S. recovery has been strong and today we had the benefit of looking it through a recent historical perspective. This should guide us in our investment decision framework going forward. A potential catalyst for the SPY would be a good Advance fourth quarter GDP reading exceeding expectations of 3.0% on 30 January 2015. If you are going to take a long position on SPY, it would be advisable to do so before that. Scalper1 News
Scalper1 News