Scalper1 News
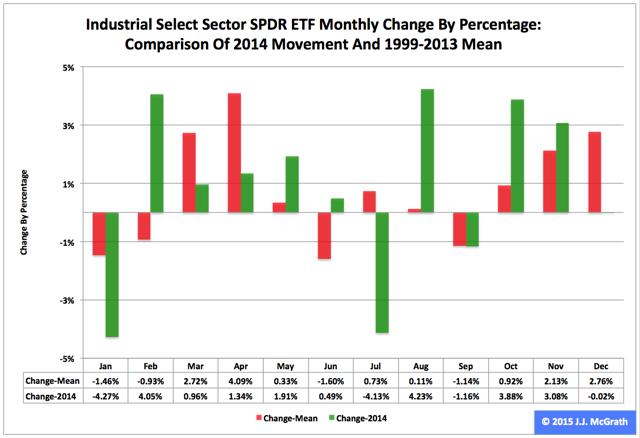
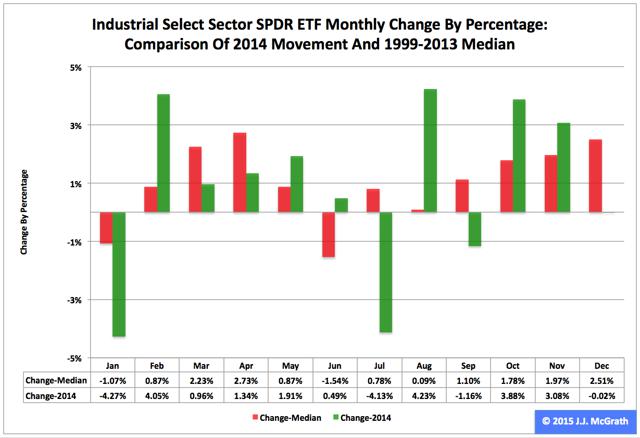
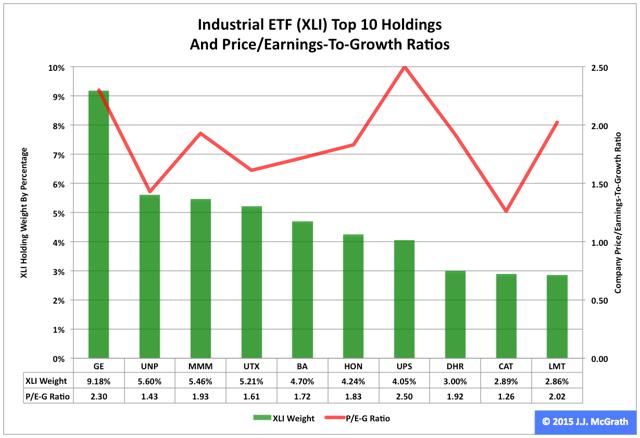 Summary The Industrial exchange-traded fund finished sixth by return among the nine Select Sector SPDRs in 2014. The ETF was especially strong in the fourth quarter of last year, when it advanced 7.06 percent. However, seasonality analysis indicates the fund could be weak in the first quarter of this year. The Industrial Select Sector SPDR ETF (NYSEARCA: XLI ) in 2014 ranked No. 6 by return among the Select Sector SPDRs that cut the S&P 500 into nine sections. On an adjusted closing daily share-price basis, XLI grew to $56.58 from $51.27, an increase of $5.31, or 10.36 percent. Therefore, it trailed its sibling, the Utilities Select Sector SPDR ETF (NYSEARCA: XLU ), and parent proxy, the SPDR S&P 500 Trust ETF (NYSEARCA: SPY ) by -18.38 and -3.11 percentage points, in that order. (XLI closed at $54.93 Tuesday.) XLI also ranked No. 6 among the sector SPDRs in the fourth quarter, when it behaved better than SPY by 2.16 percentage points and worse than XLU by -6.13 points. And XLI ranked No. 4 among the sector SPDRs in December, when it led SPY by 0.23 percentage point and lagged XLU by -3.59 points. Figure 1: XLI Monthly Change, 2014 Vs. 1999-2013 Mean (click to enlarge) Source: This J.J.’s Risky Business chart is based on analyses of adjusted closing monthly share prices at Yahoo Finance . XLI behaved better in 2014 than it did during its initial 15 full years of existence based on the monthly means calculated by employing data associated with that historical time frame (Figure 1). The same data set shows the average year’s weakest quarter was the third, with a relatively small negative return, and its strongest quarter was the fourth, with an absolutely large positive return. Consistent with this pattern last year, the ETF had a small loss in Q3 and a large gain in Q4. Figure 2: XLI Monthly Change, 2014 Versus 1999-2013 Median (click to enlarge) Source: This J.J.’s Risky Business chart is based on analyses of adjusted closing monthly share prices at Yahoo Finance. XLI performed worse in 2014 than it did during its initial 15 full years of existence based on the monthly medians calculated by using data associated with that historical time frame (Figure 2). The same data set shows the average year’s weakest quarter was the third, with an absolutely large positive return, and its strongest quarter was the fourth, with an absolutely larger positive return. It also shows there is a historical statistical tendency for the ETF to struggle in January. Figure 3: XLI’s Top 10 Holdings and P/E-G Ratios, Jan. 13 (click to enlarge) Note: The XLI holding-weight-by-percentage scale is on the left (green), and the company price/earnings-to-growth ratio scale is on the right (red). Source: This J.J.’s Risky Business chart is based on data at the XLI microsite and FinViz.com (both current as of Jan. 13). The World Bank Group became the latest economic observer to offer evidence of a slowdown in the growth of gross domestic product on this planet in the Global Economic Prospects report it released Tuesday. In its most recent semiannual report, the international financial institution based in Washington estimated GDP grew 2.6 percent in 2014, compared with its forecasts of 2.8 percent last June and 3.2 percent last January: Global growth in 2014 was lower than initially expected, continuing a pattern of disappointing outturns over the past several years. Growth picked up only marginally in 2014, to 2.6 percent, from 2.5 percent in 2013. Beneath these headline numbers, increasingly divergent trends are at work in major economies. While activity in the United States and the United Kingdom has gathered momentum as labor markets heal and monetary policy remains extremely accommodative, the recovery has been sputtering in the euro area and Japan as legacies of the financial crisis linger, intertwined with structural bottlenecks. China, meanwhile, is undergoing a carefully managed slowdown. Disappointing growth in other developing countries in 2014 reflected weak external demand, but also domestic policy tightening, political uncertainties and supply-side constraints. In its GEP report, the World Bank also cut its forecasts of GDP growth in 2015, to 3.0 percent from 3.4 percent, and in 2016, to 3.3 percent from 3.5 percent. The conditions underlying these cuts in the World Bank’s forecasts appear likely to have deleterious effects on the earnings of many of XLI’s constituent companies (i.e., those with major exposures to the global economy). This is especially so given the bias divergence in monetary policy at major central banks around the world and its impact on currency-exchange rates, as discussed in “PowerShares QQQ’s 2014 And Fourth-Quarter Performance And Seasonality.” At this late stage of the economic/market cycle, the valuations of XLI’s top 10 and other holdings seem unlikely to function as tailwinds for the ETF’s price appreciation in the foreseeable future (Figure 3). However, the numbers on the S&P 500 industrial sector reported by S&P Senior Index Analyst Howard Silverblatt Dec. 31 suggest it is not hideously overvalued, with its P/E-G ratio at 1.37: not cheap to the likes of me, not dear to the likes of normal people. Disclaimer: The opinions expressed herein by the author do not constitute an investment recommendation, and they are unsuitable for employment in the making of investment decisions. The opinions expressed herein address only certain aspects of potential investment in any securities and cannot substitute for comprehensive investment analysis. The opinions expressed herein are based on an incomplete set of information, illustrative in nature, and limited in scope. In addition, the opinions expressed herein reflect the author’s best judgment as of the date of publication, and they are subject to change without notice. Scalper1 News
Scalper1 News