Scalper1 News
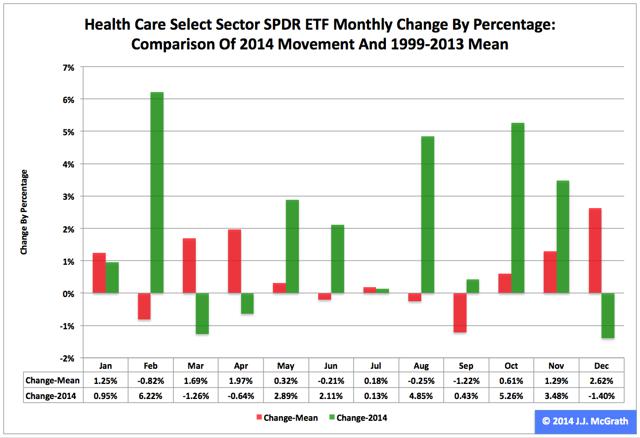
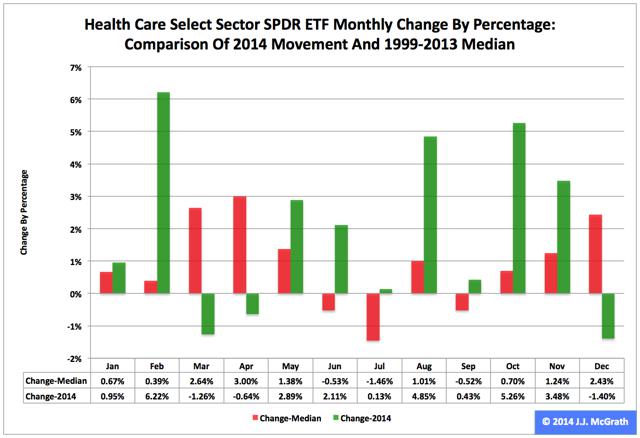
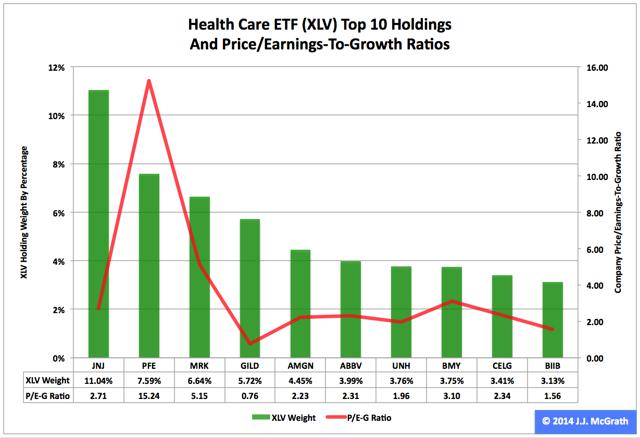 Summary The Health Care exchange-traded fund finished second by return among the nine Select Sector SPDRs in 2014. As it did so, the ETF posted the second best annual percentage gain in its 16-year history. Seasonality analysis indicates the good times may continue rolling in the first quarter. The Health Care Select Sector SPDR ETF (NYSEARCA: XLV ) was ranked No. 2 in 2014 by return among the Select Sector SPDRs that carve the S&P 500 into nine slices. On an adjusted closing daily share price basis, XLV ballooned to $68.38 from $54.64, a swelling of $13.74, or 25.15 percent. As a result, it behaved better than its parent proxy SPDR S&P 500 ETF (NYSEARCA: SPY ) by 11.68 percentage points and worse than its sibling Utilities Select Sector SPDR ETF (NYSEARCA: XLU ) by -3.59 points. (XLV closed at $70.84 Thursday.) XLV ranked No. 4 among the sector SPDRs in the fourth quarter, when it led SPY by 2.50 percentage points and lagged XLU, the Consumer Discretionary Select Sector SPDR ETF (NYSEARCA: XLY ) and the Consumer Staples Select Sector SPDR ETF (NYSEARCA: XLP ) by -5.79, -1.25 and -0.86 points, in that order. However, XLV ranked No. 8 among the sector SPDRs in December, when it performed better than the Technology Select Sector SPDR ETF (NYSEARCA: XLK ) by 0.78 percentage point and worse than SPY by 1.15 points. Overall, XLV posted the second best annual percentage return in its 16-year history: Its record was set in 2013, when it astounded by skyrocketing 41.41 percent. Figure 1: XLV Monthly Change, 2014 Vs. 1999-2013 Mean (click to enlarge) Source: This J.J.’s Risky Business chart is based on analyses of adjusted closing monthly share prices at Yahoo Finance . XLV behaved a lot better in 2014 than it did during its initial 15 full years of existence based on the monthly means calculated by employing data associated with that historical time frame (Figure 1). The same data set shows the average year’s weakest quarter was the third, with a relatively large negative return, and its strongest quarter was the fourth, with an absolutely large positive return. Inconsistent with this pattern, the ETF had excellent gains each and every quarter last year. Figure 2: XLV Monthly Change, 2014 Versus 1999-2013 Median (click to enlarge) Source: This J.J.’s Risky Business chart is based on analyses of adjusted closing monthly share prices at Yahoo Finance. XLV also performed a lot better in 2014 than it did during its initial 15 full years of existence based on the monthly medians calculated by using data associated with that historical time frame (Figure 2). The same data set shows the average year’s weakest quarter was the third, with a relatively small negative return, and its strongest quarter was the fourth, with an absolutely large positive return. Meanwhile, there is a historical statistical tendency for the ETF to do well in Q1. Figure 3: XLV’s Top 10 Holdings and P/E-G Ratios, Jan. 8 (click to enlarge) Note: The XLV holding-weight-by-percentage scale is on the left (green), and the company price/earnings-to-growth ratio scale is on the right (red). Source: This J.J.’s Risky Business chart is based on data at the XLV microsite and FinViz.com (both current as of Jan. 8). The health-care sector in general and XLV in particular progressed from a sweet spot to a sweeter spot to an even sweeter spot between June 2012 and October 2014. As discussed elsewhere previously, it appears XLV’s share price was driven by these key factors: Obamacare: The Affordable Care Act’s constitutionality was established in the landmark National Federation of Independent Business v. Sebelius decision handed down by the U.S. Supreme Court June 28, 2012, as documented by the court. Quantitative Easing: The Federal Open Market Committee announced the launch of the U.S. Federal Reserve’s latest QE program Sept. 13 the same year, as noted in “SPY, MDY And IJR At The Fed’s QE3+ Market Top.” Sector Rotation: A signal for such rotation, the beginning of the end of the Fed’s QE3+ program was announced by the FOMC Dec. 18, 2012, as pointed out in “Building A Martin Zweig-Like Fed Indicator Integrating Innovations Of The 21st Century.” The FOMC announced the completion of asset purchases under the QE3+ program last Oct. 29, so QE will not be a key driver of XLV in the first quarter. However, the other two factors may continue to be in play. A big risk to XLV and its constituent companies is the Obamacare-related King v. Burwell case currently before the U.S. Supreme Court. The justices most likely will hear arguments in March, according to the SCOTUSblog . They are expected to deliver a decision by July, with the ruling constituting a binary event for the Health Care ETF, as follows: If the decision is favorable to Obamacare, then its effect on XLV’s share price may be relatively small and short lasting. One analog might be the move in SPY between Dec. 17 and Dec. 29, associated with the FOMC statement on the former date. If the ruling is unfavorable to Obamacare, then its impact on XLV’s share price may be absolutely large and long lasting. One analog might be the move in the Energy Select Sector SPDR ETF (NYSEARCA: XLE ) from June 20 to the present, associated with the crude oil price attaining either a long term or a cycle peak on the former date. Incredibly, the health-care sector’s and XLV’s awesome performances the past couple of years have not resulted in too many absurd valuations, as indicated by the above chart (Figure 3) and numbers reported by S&P Senior Index Analyst Howard Silverblatt, Dec. 31. At that time, Silverblatt indicated the P/E-G ratio of the S&P 500 healthcare sector was 1.38, which may look a little dear to growth and value folks like me but a lot cheap to normal people. Disclaimer: The opinions expressed herein by the author do not constitute an investment recommendation, and they are unsuitable for employment in the making of investment decisions. The opinions expressed herein address only certain aspects of potential investment in any securities and cannot substitute for comprehensive investment analysis. The opinions expressed herein are based on an incomplete set of information, illustrative in nature, and limited in scope. In addition, the opinions expressed herein reflect the author’s best judgment as of the date of publication, and they are subject to change without notice. Scalper1 News
Scalper1 News