Scalper1 News
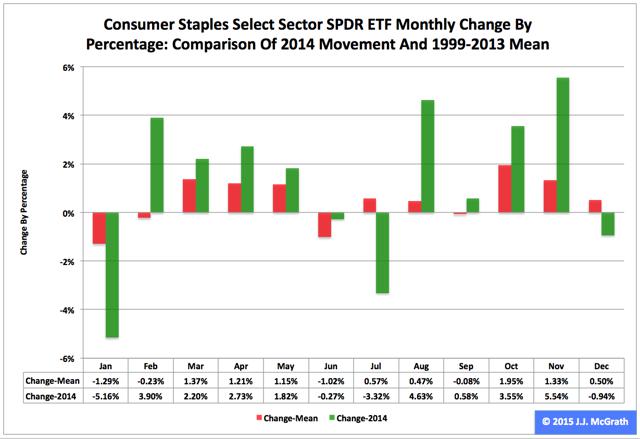
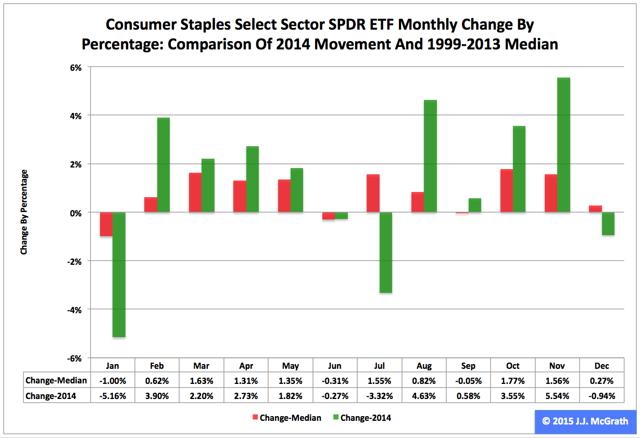
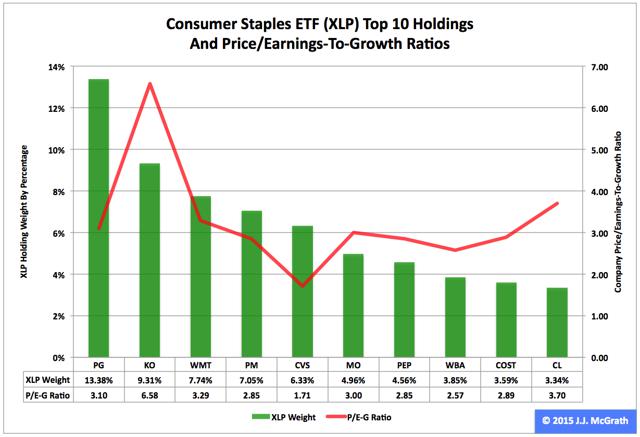 Summary The Consumer Staples exchange-traded fund finished fourth by return among the nine Select Sector SPDRs in 2014. Along the way, the ETF had a big up month in November (5.54 percent) and a big down month in January (-5.16 percent). Seasonality analysis indicates the fund could have a tough first quarter. The Consumer Staples Select Sector SPDR ETF (NYSEARCA: XLP ) in 2014 ranked No. 4 by return among the Select Sector SPDRs that chop the S&P 500 into nine morsels. On an adjusted closing daily share-price basis, XLP ascended to $48.49 from $41.90, a climb of $6.59, or 15.73 percent. Accordingly, it led its parent proxy SPDR S&P 500 Trust ETF (NYSEARCA: SPY ) by 2.26 percentage points and lagged its sibling Utilities Select Sector SPDR ETF (NYSEARCA: XLU ) by -13.01 points. (XLP closed at $48.96 Monday.) XLP ranked No. 3 among the sector SPDRs in the fourth quarter, when it behaved better than SPY by 3.36 percentage points and worse than XLU by -4.92 points. And XLP ranked No. 7 among the sector SPDRs in December, when it performed worse than XLU and SPY by -4.52 and -0.69 percentage points, in that order. Figure 1: XLP Monthly Change, 2014 Vs. 1999-2013 Mean (click to enlarge) Source: This J.J.’s Risky Business chart is based on analyses of adjusted closing monthly share prices at Yahoo Finance . XLP behaved a lot better in 2014 than it did during its initial 15 full years of existence based on the monthly means calculated by employing data associated with that historical time frame (Figure 1). The same data set shows the average year’s weakest quarter was the first, with a relatively small negative return, and its strongest quarter was the fourth, with an absolutely large positive return. Generally consistent with this pattern, the ETF had a huge gain in the fourth quarter last year. Figure 2: XLP Monthly Change, 2014 Versus 1999-2013 Median (click to enlarge) Source: This J.J.’s Risky Business chart is based on analyses of adjusted closing monthly share prices at Yahoo Finance. XLP also performed a lot better in 2014 than it did during its initial 15 full years of existence based on the monthly medians calculated by using data associated with that historical time frame (Figure 2). The same data set shows the average year’s weakest quarter was the first, with a relatively small positive return, and its strongest quarter was the fourth, with an absolutely large positive return. Clearly, this means there is no historical statistical tendency for the ETF to explode in Q1. Figure 3: XLP’s Top 10 Holdings and P/E-G Ratios, Jan. 9 (click to enlarge) Note: The XLP holding-weight-by-percentage scale is on the left (green), and the company price/earnings-to-growth ratio scale is on the right (red). Source: This J.J.’s Risky Business chart is based on data at the XLP microsite and FinViz.com (both current as of Jan. 9). It is an article of faith (and statistical interpretation) hereabouts that so-called PUV analysis is better than psychoanalysis in determining Mr. Market’s state of mind. So what is PUV analysis? It is basically the study of the behaviors of XLP, XLU and the Health Care Select Sector SPDR ETF (NYSEARCA: XLV ) in comparison with their sibling Select Sector SPDRs. If the PUV cluster of ETFs ranks in or near the top third of the sector SPDRs by return during a given period, then I believe market participants are in risk-off mode; if the PUV cluster of ETFs ranks in or near the bottom third of the sector SPDRs by return over a given period, then I think market participants are in risk-on mode. Given the relative performances of the low-beta PUV cluster members (aka XLP, XLU and XLV) that led them to finish in three of the top four spots among the sector SPDRs last year, I believe market participants were in risk-off mode. And I think they will continue to be so this year, with changes in policy at the U.S. Federal Reserve the biggest reason why. Despite the long-term sector rotation into the PUV cluster at this late stage of the economic/market cycle, the valuations of XLP’s top 10 and other holdings may be a drag on the ETF’s price appreciation in the foreseeable future (Figure 3). Numbers reported by S&P Senior Index Analyst Howard Silverblatt supported this hypothesis Dec. 31, when he pegged the P/E-G ratio of the S&P 500 consumer-staples sector at 2.12, which is pretty rich for the blood of at least one PUV analyst (i.e., me). Disclaimer: The opinions expressed herein by the author do not constitute an investment recommendation, and they are unsuitable for employment in the making of investment decisions. The opinions expressed herein address only certain aspects of potential investment in any securities and cannot substitute for comprehensive investment analysis. The opinions expressed herein are based on an incomplete set of information, illustrative in nature, and limited in scope. In addition, the opinions expressed herein reflect the author’s best judgment as of the date of publication, and they are subject to change without notice. Scalper1 News
Scalper1 News