Scalper1 News
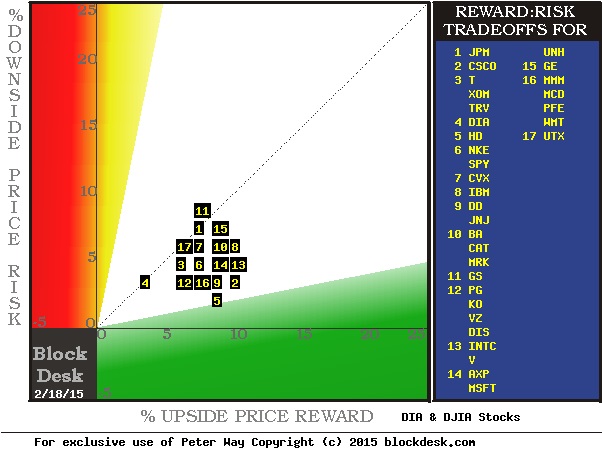
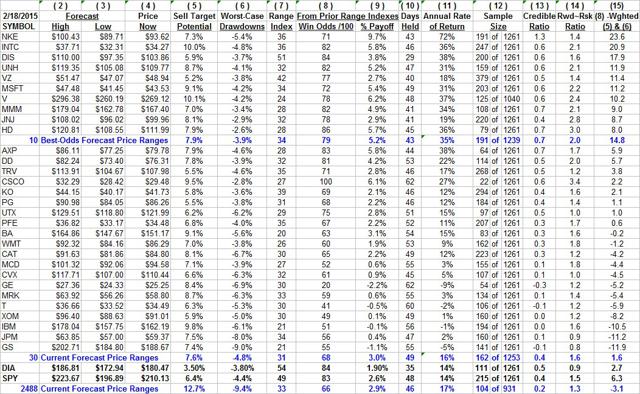 Summary Very few Exchange-Traded Funds get analyzed in detail, down at the individual holdings level. The DIA lends itself to that by its few, prominent components. The diverse nature of the 30 stocks in the DJIA Index, by design, raises the question of how to rate a CAT in comparison to a PG or a MSFT. And who’s doing the rating? What’s their bias? How do they define risk, and how is that balanced against reward? We get the Market-Making [MM] community to tell us daily, how far up and down the prices of the 30 stocks, and the DIA ETF, are likely to go next. Not voluntarily. But MM capital is regularly put at risk, protected by hedging transactions, helping big-$ funds adjust their portfolio holdings. The hedges’ cost and structure provide price range forecasts. Market-Makers never saw a profit they didn’t like or a risk they did Their principal customers, big-money institutional investment funds, work hard constantly, trying to stay employed at sweet-salary jobs by getting the capital in their charge to perform competitively. That takes shuffling around a lot of “chips” on their “poker table”. The size of their bets often stretches the capacity of markets’ ordinary way, every-day trading. To try to get their volume trade orders of 10,000 shares or sometimes millions of shares “filled” without chasing the issue’s price away from what they want to get, they often use trusted investment bank block-trade services. The kinds of stocks in the DJIA Index are just the ones most likely to see this sort of activity, which often dominates their price movement. The block trade house “makes the market” some 95% of the time by putting its own capital at risk temporarily, positioning that stub end of the “other side of the trade” that the other players in the Street will not accommodate right now, at the desired price. But the MM’s risk is always hedged by side bets in derivative securities – at a cost. Because of the cost, such protection is rarely overbought, because the fund originating the block order has to absorb the cost in the single price per share for the entire transaction. When the cost is too high, the fund balks, and the trade proposition is killed, along with its juicy (to the MM) transaction spread. So all the motivations are there to keep that game honest since the sellers of the price change protection insurance are often the proprietary trading desks of other MM firms. They are as equally well-informed on the future prospects of the subject as the house handling the block trade. And the competitive nature of the community is reminiscent of the seagull dock scene in the film “Finding Nemo”. Mine! Mine! Our Behavioral Analysis of the intelligent actions of the market professionals produces for each subject a price range MMs consider worth protecting against, either as a buyer or a seller of the protection. The change from current market quote to the upper end of the range is a forecast of possible, even likely, price gain, or reward. The opposite direction is a forecast of the kind of price drawdown risk that could be encountered. That risk may not have to be accepted and recognized as a loss, if in time the price rises. But the period the investment is “under water” is an emotionally disturbing condition, one that often leads investors to loss-taking to prevent the present from getting worse. Sometimes their fears are justified, and worst-case price drawdowns increase the emotional stress to the breaking point where investors accept what appears to be “inevitable”, but could have been avoided. Knowing what the worst has been and the odds of recovery to a profitable position from there minimizes that mistake. We have an established, Time-Efficient Risk Management Discipline [TERMD] procedure of portfolio management that enables us to evaluate the odds of a subject investment’s recovery from a price drawdown, back to a profitable transaction experience. That procedure, applied to all prior forecasts with upside to downside forecast proportions, usually gives a history from hundreds of actual market experiences. Figure 1 is a reward-to-risk map of the 30 DJIA stocks showing their current hedging-derived upside forecasts (on the green horizontal scale) and their worst-case price drawdowns (on the red vertical scale) following prior forecasts like today’s. Figure 1 (used with permission) The advantage of diversification is apparent in DIA [4], with worst-case price drawdowns no worse than all but one of the 30 stocks – at today’s market quotes and upside forecasts. The cost of that diversification is also apparent in the DIA’s upside prospect now being about +3%, compared to the average of the individual stocks of some +5% higher, around +8%. To get the odds for price recovery and a profitable transaction from today’s market prices, we need to check out column (8) of figure 2, today’s appraisals by MMs for the 30 stocks. Figure 2 (click to enlarge) Whoa! There’s a mess of numbers here. The MMs’ price range forecasts for the 30 stocks are in the first two data columns of Figure 2, followed by their separate forecasts for the SPDR Dow Jones Industrial Average ETF (NYSEARCA: DIA ), and as an additional market average index, the SPDR S&P 500 Trust ETF (NYSEARCA: SPY ). The upside percent price change potential is in (5), and the worst-case prior price drawdowns are in (6). These are the coordinates used in Figure 1. The odds of a price recovery from worst-case price drawdowns are in column (8). For example, down at the bottom of the table are DIA and SPY, which have histories of 111 days and 215 days out of the last 5 years, 1,261 market days, in which 84 or 83 out of every 100 produced a profitable transaction using our standard TERMD portfolio management discipline. That is about 5 out of every 6 trades. The average gain by DIA (column 9) from all 111 such positions was only +1.9%. That compares to Disney (NYSE: DIS ) up near the top of figure 2, with a similar 84/100 odds, but it has an achieved gain of twice that of DIA at +3.8%. Further, it took (column 10) only 29 market days – 6 weeks – to reach its sell targets or 3-month holding time limits while DIA took 35 days, or 7 weeks. For the investor most concerned with safety of principal and averse to investing choices, the difference is trivial, inconsequential. But for the investor attempting to build wealth, the compounding of 3.8% gains more than 8 ½ times a year, compared to 1.9% compounded 7 times makes the difference in investment growth of +38% a year vs. +14% (column 11). We have ranked the 30 stocks held in DIA by their forecast price growth per day held (in prior like forecasts) weighted by their prior odds of profit, net of worst-case losses weighted by their odds of loss, with some other minor adjustments, to get an odds-weighted (reward vs. risk) figure of merit for each of these stocks in (15). It is a useful means of setting preferences between investment alternatives for investors concerned with growing their investment wealth. For those concerned with safety or income, it is far less useful. Comparing (15) data for the top ten such ranked DJIA stocks in the upper blue row so labeled, with the next blue row, averaging all 30, shows that at current market prices the top ten are 9 times (14.8 vs. 1.6) as beneficial to the DIA as the other two-thirds of the holdings. Comparing DIA to SPY finds the broader market average is more than twice as strong by this measure, (6.3 vs. 2.7). That may be a suggestion that the DJIA Index is now higher priced temporarily than the S&P 500. Other comparisons, not shown, lead to the same conclusion. The more interesting comparisons are between the average of nearly 2,500 stocks and ETFs, and the market indexes, DIA and SPY. Upside price change forecasts are twice as large for the population as for SPY and 3+ times as large as for DIA. But history shows them to be far riskier (6) at -9.4% price drawdowns than either ETF. That difference, plus far lower odds of capturing a profit (66 out of 100 in column 8), combine to create a net negative figure of merit in (15). Both ETFs provide the security of positive measures. Conclusion DIA at its current market quote offers investing prospects far less attractive than the principal market-average-tracking alternative SPY. An examination of the DIA holdings individually puts over a third of them in the category of a negative influence on the DJIA Index, and thus on DIA. While the ETFs S&P and DIA do provide safety from large price drawdowns encountered by individual stocks, they may give that reward at a high cost to future wealth growth from selective use of specific index holdings. Disclosure: The author has no positions in any stocks mentioned, and no plans to initiate any positions within the next 72 hours. (More…) The author wrote this article themselves, and it expresses their own opinions. The author is not receiving compensation for it (other than from Seeking Alpha). The author has no business relationship with any company whose stock is mentioned in this article. Scalper1 News
Scalper1 News