Scalper1 News
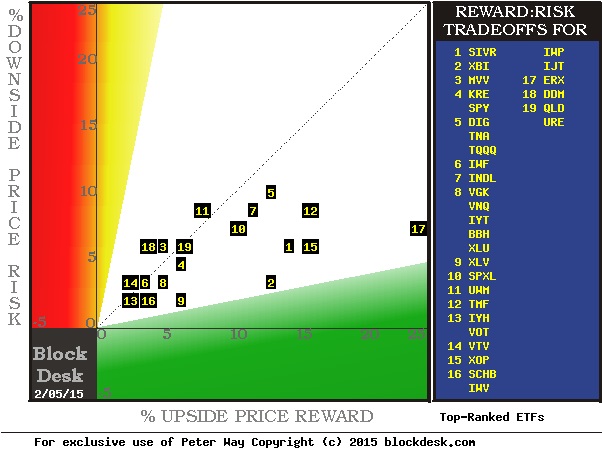
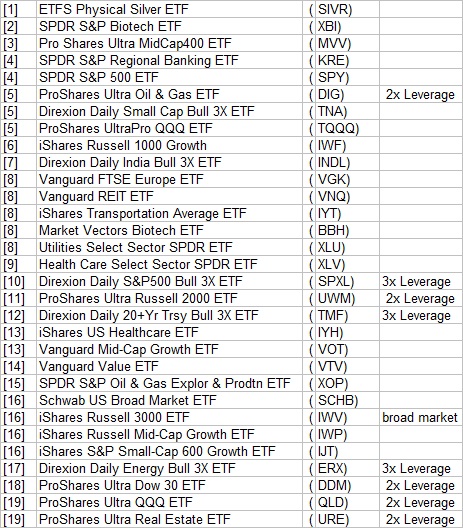
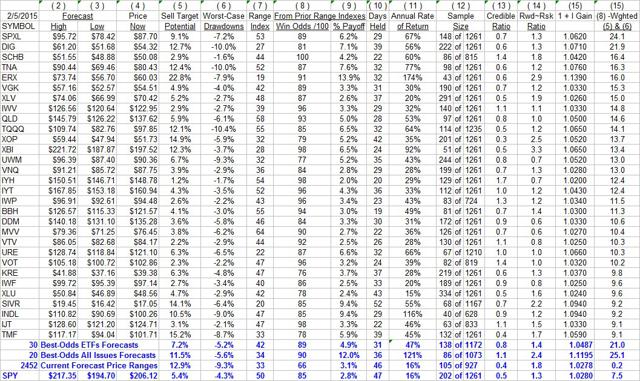 Summary ETFs provide diversification defenses against specific-issue calamity, while providing thematic focus on general investment opportunity notions – maybe good reward~risk tradeoff. Same argument for leveraged long broad-market ETFs. Using wealth-building objective strategy to rank ETFs provides ability to compare attractiveness of many, varied investing themes at one point in time. Here are 30+ ETFs at present price-based Market-Maker expectations for coming prices put to such a comparison. What is the wealth-building strategy? An active-investment one, minimizing required capital holding periods while seeking high odds for profitable outcomes. It is based on prior experience of applying the strategy, which pits Market-Maker [MM] upside price change prospects, derived from their specific issue hedging actions, against worst-case price drawdown encounters. All prior forecasts with price upside to downside outlooks like the present are subjected to a regimen of buy at the next market day close and sell upon reaching the forecast upside price, or no later than 3 months after the forecast day, regardless of gain or loss. The ranking requires at least a two to five year daily history of forecast price ranges and observes the frequency of profitable results of the regimen described above on all forecasts like today’s. The win-loss ratio proportions are applied to the upside price change forecast and the average worst-case price drawdowns encountered during prior holding periods. That net reward-minus-risk result is multiplied by the number of prior forecasts to get a figure of merit for ranking purposes. This proof-of-the-pudding approach keeps our taste restricted strictly to the objective of accumulating capital in the most time-efficient way. The following picture shows how the upside forecast rewards (horizontal green scale) compare to the historical risk exposures (vertical red scale) for over 30 best-ranked ETFs at last night’s close. Figure 1 (used with permission) The R~R map’s identity numbering has no particular significance. The presence of leveraged long market indexes is notable. Among ETFs their leverage is clearly a plus. The diversity of focus among the top ETFs is instructive: But there are other dimensions that matter. Here in ranked order are their details: Figure 2 (click to enlarge) The table of Figure 2 takes on the format of our daily “topTen” ranking of all 2500 or so stocks, indexes and ETFs that provide sufficient hedging data to reasonably imply the price ranges justifying the price protection being bought by market-makers. The averages rows in blue at the bottom of Figure 2 are to offer perspective of how these 30 “best” ETFs compare with other market investment alternatives at present. Of the daily overall rankings, today’s other 20 best have substantially stronger upside prospects (6) of 11 1/2%, compared to the ETFs +7.2%. But the ETFs demonstrate shorter average holding times (10) needed to reach sell targets, about 6 weeks, compared to 7 weeks for the best single-company securities, and 9+ weeks for the entire population and the usual market-metric of the S&P 500, the SPDR S&P 500 Trust ETF (NYSEARCA: SPY ). But both “best” lists average wins in 9 out of ten prior commitments following prior forecasts like today’s. Please remember that this is not a durable appraisal of long-term prospects for these securities. Instead, it is a scorecard, of the moment, of the likelihood of market-price movements in coming days, weeks and a few months, as seen by investment professionals with fairly short time horizons. The rankings can be impacted heavily by current market price changes, and will certainly be different a week from now. By design of strategy, none of these ETFs purchased tomorrow should still be still among holdings the first week of May, and many will have had two closeouts of the employed capital in that period. The price range forecasts in the first two data columns (2) and (3) of Figure 2 set the balance of upside to downside price change prospects shown in (7). The selection of prior forecasts with similar balance (12) is where the historic norms in (8) through (11) come from. The ranking is scored in (15), with other qualitative measures in (13) and (14). Conclusion All 30 of these ETFs have good wealth-building promise at this point, with strengths in different dimensions which may have particular preferencing appeal for different investors. But for all those with a wealth-building objective, the strategy is continuing, repetitive, active investing attention, in a series of small bites with a high percentage of profitable transactions to a small proportion of unsatisfactory ones. Careful management of time invested, along with capital, is what produces growth at rates often regarded by the less careful as impossible to achieve without taking dangerous risks. Quite the contrary, the growth comes from having an informed perspective and a solid, active discipline within which to monitor and continually renew accomplishments. Disclosure: The author has no positions in any stocks mentioned, and no plans to initiate any positions within the next 72 hours. (More…) The author wrote this article themselves, and it expresses their own opinions. The author is not receiving compensation for it (other than from Seeking Alpha). The author has no business relationship with any company whose stock is mentioned in this article. Scalper1 News
Scalper1 News