Scalper1 News
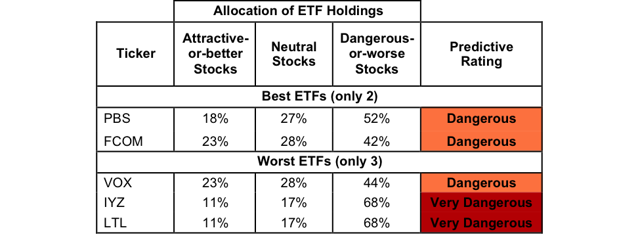
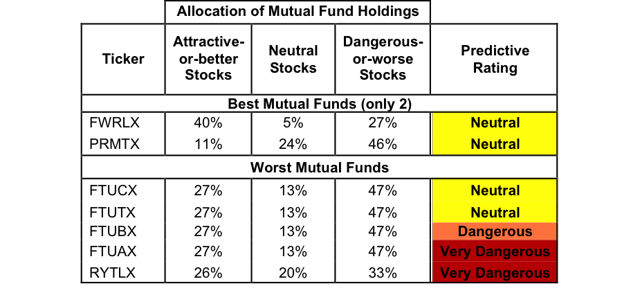
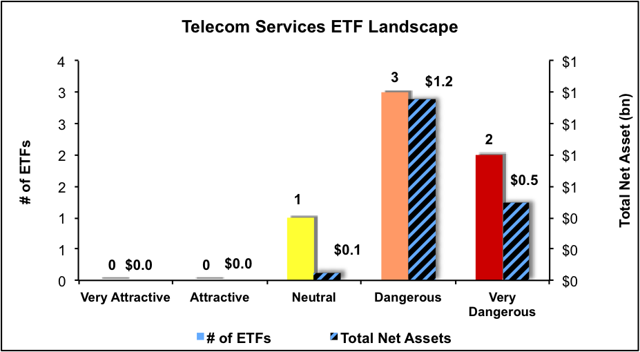
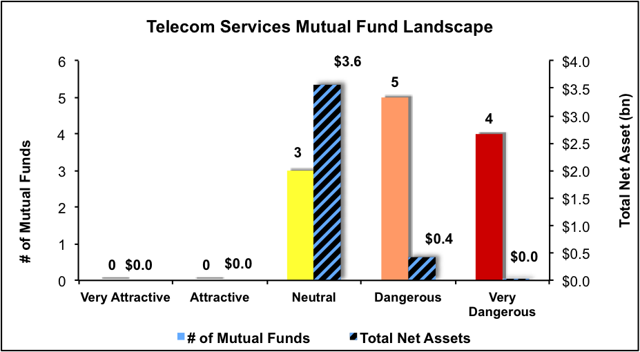 Summary Telecom Services sector ranks seventh in Q3’15. Based on an aggregation of ratings of six ETFs and 12 mutual funds. PBS is our top-rated Telecom Services ETF and FWRLX is our top-rated Telecom Services mutual fund. The Telecom Services sector ranks seventh out of the 10 sectors as detailed in our Q3’15 Sector Ratings for ETFs and Mutual Funds report. It gets our Dangerous rating, which is based on an aggregation of ratings of six ETFs and 12 mutual funds in the Telecom Services sector. See a recap of our Q2’15 Sector Ratings here. Figure 1 ranks all five ETFs and Figure 2 ranks the five best and worst mutual funds in the sector that meet our liquidity standards. Note that even the best Telecom Services ETFs fail to earn an Attractive-or-better rating. Not all Telecom Services sector ETFs and mutual funds are created the same. The number of holdings varies widely (from 23 to 55). This variation creates drastically different investment implications and, therefore, ratings. Investors should not buy any Telecom Services ETFs or mutual funds because none get an Attractive-or-better rating. If you must have exposure to this sector, you should buy a basket of Attractive-or-better rated stocks and avoid paying undeserved fund fees. Active management has a long history of not paying off. Figure 1: ETFs with the Best & Worst Ratings – Top 5 (click to enlarge) * Best ETFs exclude ETFs with TNAs less than $100 million for inadequate liquidity. Sources: New Constructs, LLC and company filings The SPDR S&P Telecom ETF (NYSEARCA: XTL ) is excluded from Figure 1 because its total net assets are below $100 million and do not meet our liquidity minimums. Figure 2: Mutual Funds with the Best & Worst Ratings – Top 5 (click to enlarge) * Best mutual funds exclude funds with TNAs less than $100 million for inadequate liquidity. Sources: New Constructs, LLC and company filings The Rydex Series Telecommunications Fund (MUTF: RYMIX ) (MUTF: RYMAX ) (MUTF: RYCSX ) is excluded from Figure 2 because its total net assets are below $100 million and do not meet our liquidity minimums. The PowerShares Dynamic Media Portfolio ETF (NYSEARCA: PBS ) is the top-rated Telecom Services ETF and the Fidelity Select Wireless Portfolio (MUTF: FWRLX ) is the top-rated Telecom Services mutual fund. PBS earns a Dangerous rating and FWRLX earns a Neutral rating. The ProShares Ultra Telecommunications ETF (NYSEARCA: LTL ) is the worst-rated Telecom Services ETF and the Rydex Telecommunications Fund (MUTF: RYTLX ) is the worst-rated Telecom Services mutual fund. Both earn a Very Dangerous rating. 43 stocks of the 3000+ we cover are classified as Telecom Services stocks, but due to style drift, Telecom Services ETFs and mutual funds hold 55 stocks. Inteliquent Inc. (NASDAQ: IQNT ), on the Most Attractive Stocks List in July , is one of our favorite stocks held by Telecom Services ETFs and mutual funds and earns our Very Attractive rating. Since 2007, Inteliquent has grown after-tax profit ( NOPAT ) by 24% compounded annually. In addition to strong profit growth, the company improved its return on invested capital ( ROIC ) to 28% from 11% in 2012. Despite the strong underlying business performance, IQNT remains undervalued. At its current price of $18/share, Inteliquent has a price to economic book value ( PEBV ) ratio of 1.1. This ratio implies that the market expects NOPAT to grow by 10% from its current level. If Inteliquent can grow NOPAT by 7% compounded annually for the next decade, the stock is worth $24/share today – a 33% upside. Cincinnati Bell, Inc. (NYSE: CBB ) is one of our least favorite stocks held by Telecom Services ETFs and mutual funds and earns our Very Dangerous rating. Over the past five years, Cincinnati Bell’s NOPAT has declined by 19% compounded annually. Even worse, Cincinnati Bell has failed to create shareholder value by failing to generate positive economic earnings for 11 consecutive years. Despite years of poor business fundamentals, CBB is overvalued. To justify its current price of ~$4/share, Cincinnati Bell must grow NOPAT by 9% compounded annually for the next 12 years. Owning this stock and, ergo, betting on the company to pull off such an extended turnaround given its recent struggles is quite risky. Figures 3 and 4 show the rating landscape of all Telecom Services ETFs and mutual funds. Figure 3: Separating the Best ETFs From the Worst ETFs (click to enlarge) Sources: New Constructs, LLC and company filings Figure 4: Separating the Best Mutual Funds From the Worst Mutual Funds (click to enlarge) Sources: New Constructs, LLC and company filings D isclosure: David Trainer, Kyle Guske II, and Max Lee receive no compensation to write about any specific stock, sector or theme. Disclosure: I/we have no positions in any stocks mentioned, and no plans to initiate any positions within the next 72 hours. (More…) I wrote this article myself, and it expresses my own opinions. I am not receiving compensation for it. I have no business relationship with any company whose stock is mentioned in this article. Scalper1 News
Scalper1 News