Scalper1 News
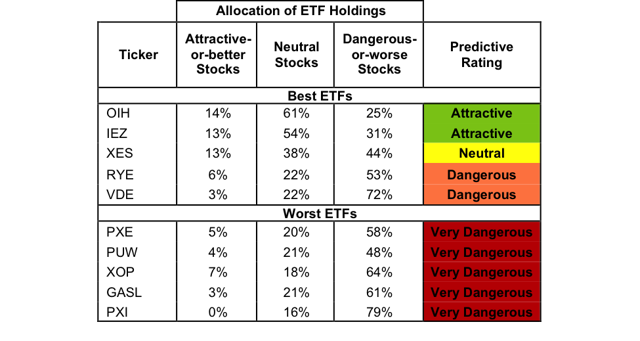
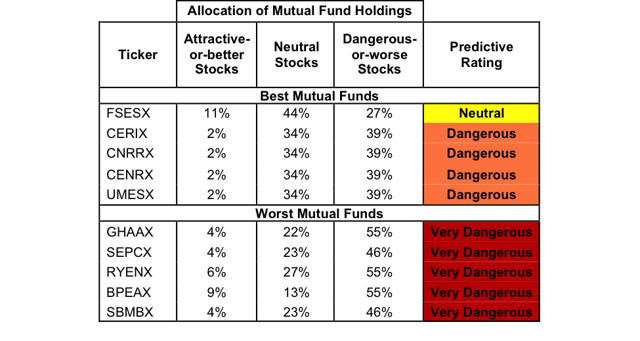
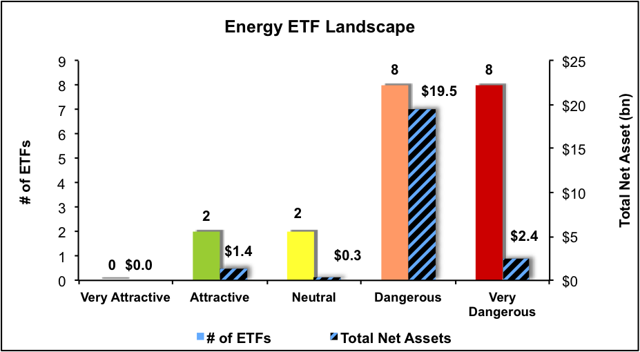
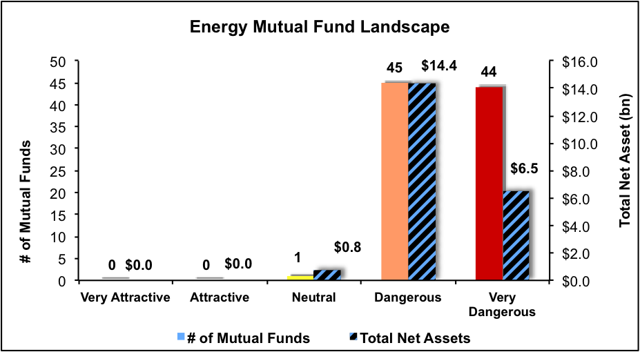 Summary The Energy sector ranks last in Q3’15. Based on an aggregation of ratings of 20 ETFs and 90 mutual funds in the Energy sector. OIH is our top-rated Energy ETF and FSESX is our top-rated Energy mutual fund. The Energy sector ranks last out of the 10 sectors as detailed in our Q3’15 Sector Ratings for ETFs and Mutual Funds report. It gets our Dangerous rating, which is based on aggregation of ratings of 20 ETFs and 90 mutual funds in the Energy sector. See a recap of our Q2’15 Sector Ratings here . Figures 1 and 2 show the five best and worst-rated ETFs and mutual funds in the sector. Not all Energy sector ETFs and mutual funds are created the same. The number of holdings varies widely (from 25 to 163). This variation creates drastically different investment implications and, therefore, ratings. Investors seeking exposure to the Energy sector should buy one of the Attractive-or-better rated ETFs or mutual funds from Figures 1 and 2. Figure 1: ETFs with the Best & Worst Ratings – Top 5 (click to enlarge) * Best ETFs exclude ETFs with TNAs less than $100 million for inadequate liquidity. Sources: New Constructs, LLC and company filings The PowerShares Dynamic Oil & Gas Services Portfolio ETF (NYSEARCA: PXJ ) is excluded from Figure 1 because its total net assets are below $100 million and do not meet our liquidity minimums. Figure 2: Mutual Funds with the Best & Worst Ratings – Top 5 (click to enlarge) * Best mutual funds exclude funds with TNAs less than $100 million for inadequate liquidity. Sources: New Constructs, LLC and company filings The Market Vectors Oil Services ETF (NYSEARCA: OIH ) is the top-rated Energy ETF and the Fidelity Select Energy Service Portfolio (MUTF: FSESX ) is the top-rated Energy mutual fund. OIH earns our Attractive rating and FSESX earns our Neutral rating. The PowerShares DWA Energy Momentum Portfolio ETF (NYSEARCA: PXI ) is the worst-rated Energy ETF and the Saratoga Energy & Basic Materials Fund (MUTF: SBMBX ) is the worst-rated energy mutual fund. Both earn a Very Dangerous rating. 187 stocks of the 3000+ we cover are classified as energy stocks. National-Oilwell Varco (NYSE: NOV ) is one of our favorite stocks held by Energy ETFs and mutual funds and earns our Very Attractive rating. Since 2009, National Oilwell has grown after-tax profit ( NOPAT ) by 11% compounded annually. National Oilwell has a return on invested capital ( ROIC ) of 10% and over $4 billion in free cash flow on a trailing twelve-month basis. Due to the recent decline in energy-related securities, NOV can be purchased well below its fair value. At its current price of ~$43/share, NOV has a price to economic book value ( PEBV ) ratio of 0.6. This ratio implies that the market expects National Oilwell’s NOPAT to permanently decline by 40%. If National Oilwell can grow NOPAT by just 3% compounded annually for the next six years , the stock is worth $80/share today – an 86% upside. Marathon Petroleum Corp (NYSE: MPC ) is one of our least favorite stocks held by Energy ETFs and mutual funds and earns our Very Dangerous rating. Marathon’s NOPAT has declined from $3.3 billion in 2011 to -$589 million in 2014. ROIC has also fallen from 15% to 1%. Investors not reading the footnotes would be unaware of the deteriorating business fundamentals. Due to a change in LIFO inventory value we remove $3.4 billion from Marathon’s 2014 income statement. Without making this adjustment the market has been led to believe that profits actually grew in 2014. The disconnect between NOPAT and net income could explain why MPC is up 39% over the last year despite the Energy sector being down 27%. To justify its now overvalued price of $56/share, MPC must grow revenues by 16% compounded annually for the next 13 years while also raising its current NOPAT margin from -0.6% to 2.5%. Marathon has only grown revenue by 8% compounded annually since 2011. Expecting Marathon to double its revenue growth in a weak Energy environment and maintain that high level for over a decade seems rather optimistic. Figures 3 and 4 show the rating landscape of all Energy ETFs and mutual funds. Figure 3: Separating the Best ETFs From the Worst ETFs (click to enlarge) Sources: New Constructs, LLC and company filings Figure 4: Separating the Best Mutual Funds From the Worst Mutual Funds (click to enlarge) Sources: New Constructs, LLC and company filings D isclosure: David Trainer and Allen Jackson receive no compensation to write about any specific stock, sector or theme. Disclosure: I/we have no positions in any stocks mentioned, and no plans to initiate any positions within the next 72 hours. (More…) I wrote this article myself, and it expresses my own opinions. I am not receiving compensation for it. I have no business relationship with any company whose stock is mentioned in this article. Scalper1 News
Scalper1 News