Scalper1 News
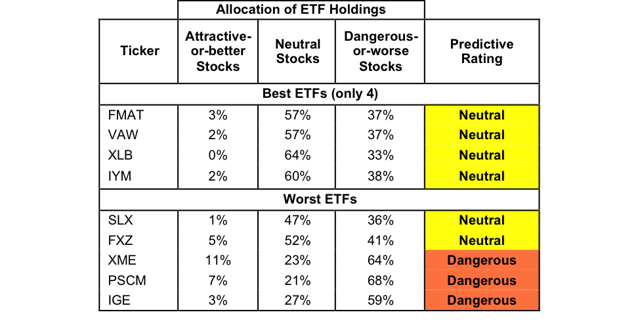
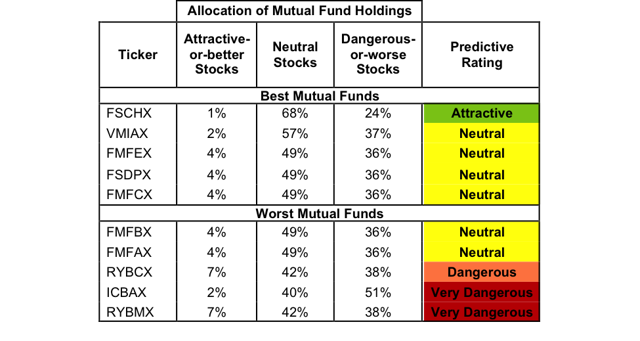
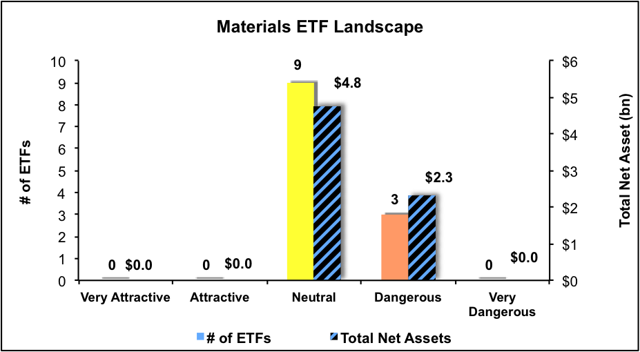
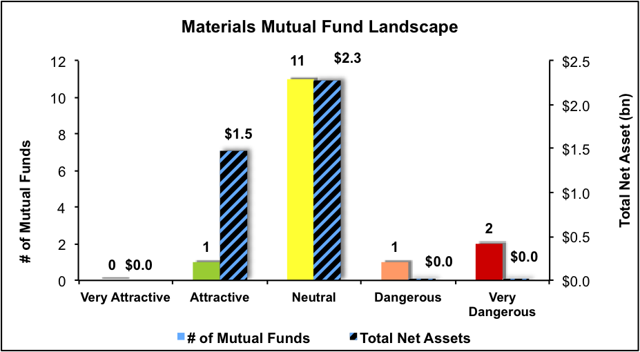 Summary Materials sector ranks sixth in Q3’15. Based on an aggregation of ratings of 12 ETFs and 15 mutual funds. FMAT is our top-rated Materials ETF and FSCHX is our top-rated Materials mutual fund. The Materials sector ranks sixth out of the 10 sectors as detailed in our Q3’15 Sector Ratings for ETFs and Mutual Funds report. It gets our Neutral rating, which is based on an aggregation of ratings of 12 ETFs and 15 mutual funds in the Materials sector. See a recap of our Q2’15 Sector Ratings here. Figures 1 ranks all nine ETFs and Figure 2 ranks the five best and five worst mutual funds in the sector. Not all Materials sector ETFs and mutual funds are created the same. The number of holdings varies widely (from 27 to 139). This variation creates drastically different investment implications and, therefore, ratings. Investors seeking exposure to the Materials sector should buy one of the Attractive-or-better rated ETFs or mutual funds from Figures 1 and 2. Figure 1: ETFs with the Best & Worst Ratings – Top 5 (click to enlarge) * Best ETFs exclude ETFs with TNAs less than $100 million for inadequate liquidity. Sources: New Constructs, LLC and company filings The PowerShares DWA Basic Materials Momentum Portfolio ETF (NYSEARCA: PYZ ), the ProShares Ultra Basic Materials ETF (NYSEARCA: UYM ) and the Guggenheim S&P Equal Weight Materials ETF (NYSEARCA: RTM ) are excluded from Figure 1 because their total net assets are below $100 million and do not meet our liquidity minimums. Figure 2: Mutual Funds with the Best & Worst Ratings – Top 5 (click to enlarge) * Best mutual funds exclude funds with TNAs less than $100 million for inadequate liquidity. Sources: New Constructs, LLC and company filings The Fidelity MSCI Materials ETF (NYSEARCA: FMAT ) is the top-rated Materials ETF and the Fidelity Select Chemicals Portfolio (MUTF: FSCHX ) is the top-rated Materials mutual fund. FMAT earns a Neutral rating and FSCHX earns an Attractive rating. The iShares Goldman Sachs Natural Resources ETF (NYSEARCA: IGE ) is the worst-rated Materials ETF and the Rydex Series Basic Materials Fund (MUTF: RYBMX ) is the worst-rated Materials mutual fund. IGE earns a Neutral rating and RYBMX earns a Very Dangerous rating. 172 stocks of the 3000+ we cover are classified as Materials stocks. Compass Minerals International, Inc. (NYSE: CMP ) is one of our favorite stocks held by Materials ETFs and mutual funds and earns our Attractive rating. Since 2012, Compass Minerals has grown after-tax profit ( NOPAT ) by 18% compounded annually. The company’s return on invested capital ( ROIC ) has also improved the past three years and is currently a top-quintile 18%. In spite of Compass Minerals’ impressive fundamental performance, the stock remains undervalued. At its current price of ~$80/share, CMP has a price to economic book value ( PEBV ) ratio of 1.0. This ratio implies that the market expects NOPAT to never grow from its current level. However, if Compass Minerals can grow NOPAT by 6% compounded annually for the next six years , the stock is worth $104/share today – a 30% upside. Hecla Mining Company (NYSE: HL ) is one of our least favorite stocks held by Materials ETFs and mutual funds and earns our Very Dangerous rating. Since 2011, Hecla’s NOPAT has declined by 46% compounded annually while revenue has only grown by 1% compounded annually. Hecla’s bottom quintile ROIC of 1% is well below the 14% it earned in 2011 as well. Unfortunately for investors, despite the stock price being down 14% YTD, it remains overvalued. To justify its current price of ~$2/share, Hecla must grow NOPAT by 14% compounded annually for the next 21 years . Two decades of double digit profit growth is a hurdle for even the best of companies and even more so for one that hasn’t grown NOPAT over the past four years. Figures 3 and 4 show the rating landscape of all Materials ETFs and mutual funds. Figure 3: Separating the Best ETFs From the Worst ETFs (click to enlarge) Sources: New Constructs, LLC and company filings Figure 4: Separating the Best Mutual Funds From the Worst Mutual Funds (click to enlarge) Sources: New Constructs, LLC and company filings D isclosure: David Trainer, Kyle Guske II, and Max Lee receive no compensation to write about any specific stock, sector or theme. Disclosure: I/we have no positions in any stocks mentioned, and no plans to initiate any positions within the next 72 hours. (More…) I wrote this article myself, and it expresses my own opinions. I am not receiving compensation for it. I have no business relationship with any company whose stock is mentioned in this article. Scalper1 News
Scalper1 News