Scalper1 News
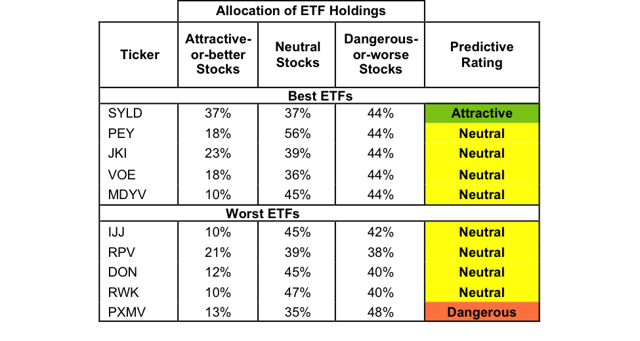
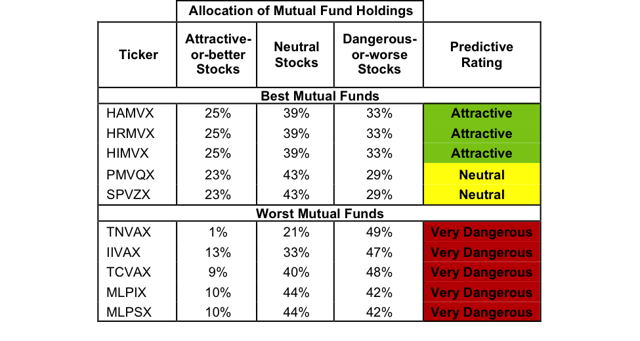
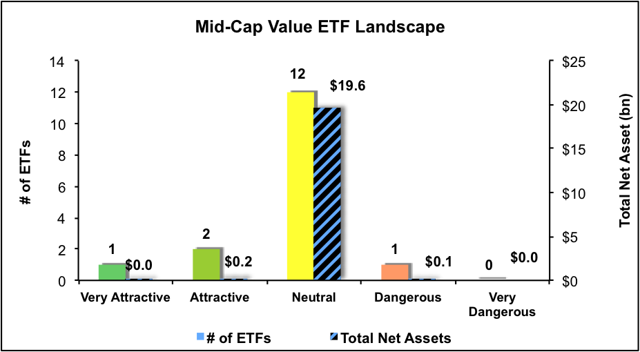
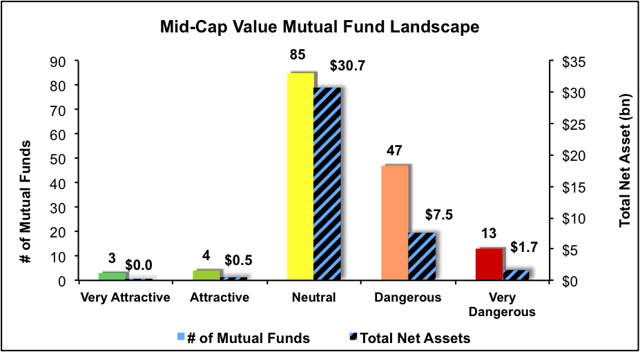 Summary Mid Cap Value style ranks seventh in Q2’15. Based on an aggregation of ratings of 16 ETFs and 166 mutual funds. SYLD is our top rated Mid Cap Value ETF and HAMVX is our top rated Mid Cap Value mutual fund. The Mid Cap Value style ranks seventh out of the 12 fund styles as detailed in our Q2’15 Style Ratings report . It gets our Dangerous rating, which is based on an aggregation of ratings of 16 ETFs and 166 mutual funds in the Mid Cap Value style. Figures 1 and 2 show the five best and worst rated ETFs and mutual funds in the style. Not all Mid Cap Value style ETFs and mutual funds are created the same. The number of holdings varies widely (from 23 to 570). This variation creates drastically different investment implications and, therefore, ratings. Investors seeking exposure to the Mid Cap Value style should buy one of the Attractive-or-better rated ETFs or mutual funds from Figures 1 and 2. Figure 1: ETFs with the Best & Worst Ratings – Top 5 (click to enlarge) * Best ETFs exclude ETFs with TNAs less than $100 million for inadequate liquidity. The First Trust RBA Quality Income ETF (NASDAQ: QINC ) and the Direxion Value Line Mid & Long Cap High Dividend ETF (NYSEARCA: VLML ) are excluded from Figure 1 because their total net assets are below $100 million and do not meet our liquidity minimums. Figure 2: Mutual Funds with the Best & Worst Ratings – Top 5 (click to enlarge) * Best mutual funds exclude funds with TNAs less than $100 million for inadequate liquidity. Nationwide Herndon Mid Cap Value Fund (Investor shares (MUTF: NWWQX ), S shares (MUTF: NWWPX ), C shares (MUTF: NWWNX ), A shares (MUTF: NWWMX )) is excluded from Figure 2 because its total net assets are below $100 million and do not meet our liquidity minimums. The Cambria Shareholder Yield ETF (NYSEARCA: SYLD ) is our top-rated Mid Cap Value ETF and the Harbor Mid Cap Value Fund (MUTF: HAMVX ) is our top-rated Mid Cap Value mutual fund. Both earn our Attractive rating. One of our favorite stocks in SYLD is Chemed Corp (NYSE: CHE ). This healthcare company provides hospice services throughout the United States. Chemed has exhibited strong and resilient operating performance. Over the past decade the company has consistently grown after-tax operating profit ( NOPAT ) by 13% compounded annually. The company currently earns a return on invested capital ( ROIC ) of 14%, up from 6% in 2004. Chemed has also generated positive economic earnings for nine consecutive years. Despite the consistent fundamental growth exhibited by Chemed, the company is undervalued at its current price of ~$131/share. If the company is able to grow NOPAT by just 9% compounded annually for the next 10 years the company is worth $156/share today – a 19% upside. The PowerShares Fundamental Pure Mid Value Portfolio ETF (NYSEARCA: PXMV ) is our worst rated the Mid Cap Value ETF and Mid-Cap Value ProFund (MUTF: MLPSX ) is our worst rated Mid Cap Value mutual fund. PXMV earns our Dangerous rating and MLPSX earns our Very Dangerous rating. One of our worst rated stocks held by Mid Cap Value ETFs and mutual funds is Alliant Energy Corp (NYSE: LNT ). LNT is a utility holding company that provides electricity and natural gas to customers in the Midwestern United States. Over the last 10 years Alliant’s ROIC has never exceeded 6% yet the company’s cost of capital ( WACC ) has exceeded its ROIC. This has resulted in negative economic earnings in 16 of the last 17 years. Over the last four years, the company’s NOPAT growth has been equally as disappointing, growing by only 2% compounded annually. However, LNT is highly overvalued at $59/share. In order to justify this price, LNT would have to grow NOPAT by 5% compounded annually for the next 11 years . While 5% NOPAT growth might not seem high, given the company has achieved less than half this growth over the past four years, this scenario seems unlikely. Figures 3 and 4 show the rating landscape of all Mid Cap Value ETFs and mutual funds. Figure 3: Separating the Best ETFs From the Worst ETFs (click to enlarge) Figure 4: Separating the Best Mutual Funds From the Worst Funds (click to enlarge) Sources Figures 1-4: New Constructs, LLC and company filings D isclosure: David Trainer and Allen L. Jackson receive no compensation to write about any specific stock, style, style or theme Disclosure: I/we have no positions in any stocks mentioned, and no plans to initiate any positions within the next 72 hours. (More…) I wrote this article myself, and it expresses my own opinions. I am not receiving compensation for it. I have no business relationship with any company whose stock is mentioned in this article. Scalper1 News
Scalper1 News