Scalper1 News
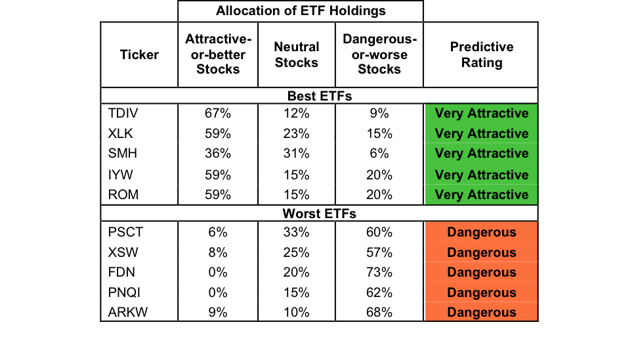
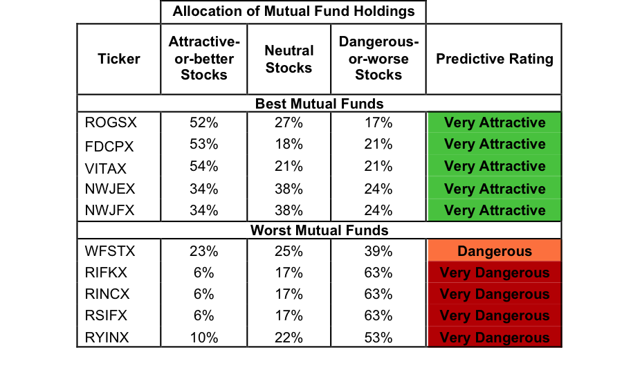
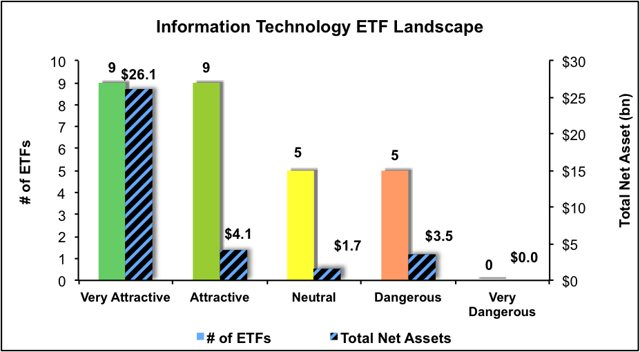
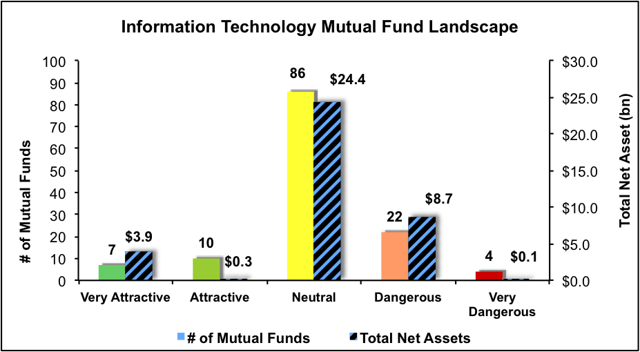 Summary Information Technology sector ranks second in Q3’15. Based on an aggregation of ratings of 28 ETFs and 129 mutual funds. TDIV is our top-rated Information Technology ETF and ROGSX is our top-rated Information Technology mutual fund. The Information Technology sector ranks second out of the 10 sectors as detailed in our Q3’15 Sector Ratings for ETFs and Mutual Funds report. It gets our Neutral rating, which is based on an aggregation of ratings of 28 ETFs and 129 mutual funds in the Information Technology sector as of July 9, 2015. See a recap of our Q2’15 Sector Ratings here . Figures 1 and 2 show the five best and worst-rated ETFs and mutual funds in the sector. Not all Information Technology sector ETFs and mutual funds are created the same. The number of holdings varies widely (from 23 to 397). This variation creates drastically different investment implications and, therefore, ratings. Investors seeking exposure to the Information Technology sector should buy one of the Attractive-or-better rated ETFs or mutual funds from Figures 1 and 2. Figure 1: ETFs with the Best & Worst Ratings – Top 5 (click to enlarge) * Best ETFs exclude ETFs with TNAs less than $100 million for inadequate liquidity. Sources: New Constructs, LLC and company filings Figure 2: Mutual Funds with the Best & Worst Ratings – Top 5 (click to enlarge) * Best mutual funds exclude funds with TNAs less than $100 million for inadequate liquidity. Sources: New Constructs, LLC and company filings The First Trust NASDAQ Technology Dividend Index ETF (NASDAQ: TDIV ) is the top-rated Information Technology ETF and the Red Oak Technology Select Fund (MUTF: ROGSX ) is the top-rated Information Technology mutual fund. Both earn a Very Attractive rating. The ARK Web x.0 ETF (NYSEARCA: ARKW ) is the worst-rated Information Technology ETF and The Rydex Internet Fund (MUTF: RYINX ) is the worst-rated Information Technology mutual fund. ARKW earns a Dangerous rating and RYINX earns a Very Dangerous rating. 527 stocks of the 3000+ we cover are classified as Information Technology stocks. Cisco Systems, Inc. (NASDAQ: CSCO ), a previous Stock Pick of the Week, is one of our favorite stocks held by TDIV and earns our Very Attractive rating. Since 2005, Cisco has grown after-tax profit ( NOPAT ) by 6% compounded annually. Cisco earns a top-quintile return on invested capital ( ROIC ) of 16% and has steadily become a free cash flow machine, generating $9.5 billion on a trailing-twelve month (TTM) basis. Fears of Cisco’s demise in a new age of technology have long kept the stock undervalued. At its current price of ~$28/share, Cisco has a price to economic book value ( PEBV ) of 0.9. This ratio implies the market expects Cisco’s profits to permanently decline by 10%. However, if Cisco can grow NOPAT by 5% compounded annually over the next decade , the stock is worth $36/share – a 28% upside. Proofpoint Inc. (NASDAQ: PFPT ) is one of our least favorite stocks held by ARKW and earns our Dangerous rating. Proofpoint is similar to many of our recent Danger Zone picks in that it touts high revenue growth but negative profits. From 2012-2014, Proofpoint grew revenue by 23% compounded annually. On the other hand, NOPAT declined from -$19 million to -$47 million. On a TTM basis, which includes 1Q15 results, NOPAT has fallen to -$52 million. Proofpoint’s pre-tax (NOPBT) margins are -26% and the company currently earns a bottom-quintile ROIC of -53%. The stock price has benefited from the hype surrounding cyber security companies and is now significantly overvalued. To justify its current price of $63/share, Proofpoint must immediately achieve 6% NOPBT margins (similar to peer Fortinet (NASDAQ: FTNT )) and grow revenues by 30% compounded annually for the next 16 years . If you want to be in a stock that benefits from the growth in cyber security, we recommend this recent stock pick of the week. Figures 3 and 4 show the rating landscape of all Information Technology ETFs and mutual funds. Figure 3: Separating the Best ETFs From the Worst ETFs (click to enlarge) Sources: New Constructs, LLC and company filings Figure 4: Separating the Best Mutual Funds From the Worst Mutual Funds (click to enlarge) Sources: New Constructs, LLC and company filings D isclosure: David Trainer and Max Lee receive no compensation to write about any specific stock, sector or theme. Disclosure: I/we have no positions in any stocks mentioned, and no plans to initiate any positions within the next 72 hours. (More…) I wrote this article myself, and it expresses my own opinions. I am not receiving compensation for it. I have no business relationship with any company whose stock is mentioned in this article. Scalper1 News
Scalper1 News