Tag Archives: fsesx

Best And Worst Q1’16: Energy ETFs, Mutual Funds And Key Holdings

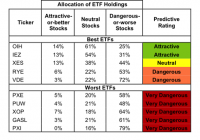
The Energy sector ranks ninth out of the ten sectors as detailed in our Q1’16 Sector Ratings for ETFs and Mutual Funds report. Last quarter , the Energy sector ranked last. It gets our Dangerous rating, which is based on aggregation of ratings of 23 ETFs and 112 mutual funds in the Energy sector. See a recap of our Q4’15 Sector Ratings here . Figures 1 and 2 show the five best and worst-rated ETFs and mutual funds in the sector. Not all Energy sector ETFs and mutual funds are created the same. The number of holdings varies widely (from 25 to 153). This variation creates drastically different investment implications and, therefore, ratings. Investors seeking exposure to the Energy sector should buy one of the Attractive-or-better rated ETFs or mutual funds from Figures 1 and 2. Figure 1: ETFs with the Best & Worst Ratings – Top 5 Click to enlarge * Best ETFs exclude ETFs with TNAs less than $100 million for inadequate liquidity. Sources: New Constructs, LLC and company filings The Van Eck Market Vectors Uranium+Nuclear Energy ETF (NYSEARCA: NLR ), the PowerShares Dynamic Oil & Gas Services Portfolio (NYSEARCA: PXJ ), and the Van Eck Market Vectors Unconventional Oil & Gas ETF (NYSEARCA: FRAK ) are excluded from Figure 1 because their total net assets are below $100 million and do not meet our liquidity minimums. Figure 2: Mutual Funds with the Best & Worst Ratings – Top 5 Click to enlarge * Best mutual funds exclude funds with TNAs less than $100 million for inadequate liquidity. Sources: New Constructs, LLC and company filings The Van Eck Market Vectors Oil Services ETF (NYSEARCA: OIH ) is the top-rated Energy ETF and the Fidelity Select Energy Service Portfolio (MUTF: FSESX ) is the top-rated Energy mutual fund. OIH earns an Attractive rating and FSESX earns a Neutral rating. The First Trust ISE Water Index Fund (NYSEARCA: FIW ) is the worst-rated Energy ETF and the Saratoga Advantage Energy and Basic Materials Portfolio (MUTF: SBMBX ) is the worst-rated Energy mutual fund. FIW earns a Dangerous rating and SBMBX earns a Very Dangerous rating. 184 stocks of the 3000+ we cover are classified as Energy stocks. The FMC Technologies (NYSE: FTI ) is one of our favorite stocks held by OIH and earns an Attractive rating. While the Energy market has certainly had its issues over the past two years, FMC Technologies business has continued to exhibit strength. Over the past five years, FMC has grown after-tax profit ( NOPAT ) by 9% compounded annually. The company currently earns a return on invested capital ( ROIC ) of 12%. Best of all, FMC has earned positive economic earnings every year since 2006. Despite the above, FTI declined over 37% in 2015. Now, at its current price of $25/share, FTI has a price to economic book value ( PEBV ) ratio of 0.8. This ratio means that the market expects FMC’s NOPAT to permanently decline by 20% over its remaining corporate life. If FMC can grow NOPAT by just 2% compounded annually for the next decade , the stock is worth $31/share today – a 24% upside. The Diamondback Energy (NASDAQ: FANG ) is one of our least favorite stocks held by SBMBX and earns a Dangerous rating. Despite reporting impressive revenue growth, Diamondback Energy’s business is in decline. The company’s economic earnings have declined from -$32 million in 2012 to -$331 million over the trailing twelve months. Diamondback’s ROIC has fallen from 3% to -2% over the same timeframe. Despite the deterioration of the business, FANG was up 12% in 2015, which has left shares highly overvalued. To justify its current price of $58/share, Diamondback must grow NOPAT by 12% compounded annually for the next 18 years . When contrasted with Diamondback’s short history of value destruction, this expectation appears overly optimistic. Figures 3 and 4 show the rating landscape of all Energy ETFs and mutual funds. Figure 3: Separating the Best ETFs From the Worst ETFs Click to enlarge Sources: New Constructs, LLC and company filings Figure 4: Separating the Best Mutual Funds From the Worst Mutual Funds Click to enlarge Sources: New Constructs, LLC and company filings D isclosure: David Trainer and Kyle Guske II receive no compensation to write about any specific stock, sector or theme.

Best And Worst Q4’15: Energy ETFs, Mutual Funds And Key Holdings

Summary The Energy sector ranks last in Q4’15. Based on an aggregation of ratings of 21 ETFs and 59 mutual funds. OIH is our top-rated Energy ETF and FSESX is our top-rated Energy mutual fund. The Energy sector ranks last out of the 10 sectors as detailed in our Q4’15 Sector Ratings for ETFs and Mutual Funds report. The Energy sector funds won last place in the prior quarter as well. It gets our Dangerous rating, which is based on aggregation of ratings of 21 ETFs and 59 mutual funds in the Energy sector. See a recap of our Q3’15 Sector Ratings here . Figures 1 and 2 show the five best and worst-rated ETFs and mutual funds in the sector. Not all Energy sector ETFs and mutual funds are created the same. The number of holdings varies widely (from 25 to 150). This variation creates drastically different investment implications and, therefore, ratings. Investors seeking exposure to the Energy sector should buy one of the Attractive-or-better rated ETFs or mutual funds from Figures 1 and 2. Figure 1: ETFs with the Best & Worst Ratings – Top 5 (click to enlarge) * Best ETFs exclude ETFs with TNAs less than $100 million for inadequate liquidity. Sources: New Constructs, LLC and company filings The PowerShares Dynamic Oil Services ETF (NYSEARCA: PXJ ) is excluded from Figure 1 because its total net assets are below $100 million and do not meet our liquidity minimums. Figure 2: Mutual Funds with the Best & Worst Ratings – Top 5 (click to enlarge) * Best mutual funds exclude funds with TNAs less than $100 million for inadequate liquidity. Sources: New Constructs, LLC and company filings The Van Eck Market Vectors Oil Services ETF (NYSEARCA: OIH ) is the top-rated Energy ETF and the Fidelity Select Energy Service Portfolio (MUTF: FSESX ) is the top-rated Energy mutual fund. OIH earns an Attractive rating while FSESX earns a Neutral rating. The PowerShares DWA Energy Momentum Portfolio ETF (NYSEARCA: PXI ) is the worst-rated Energy ETF and the BP Capital TwinLine Energy Fund (MUTF: BPEAX ) is the worst-rated Energy mutual fund. Both earn a Very Dangerous rating. National Oilwell Varco (NYSE: NOV ) is one of our favorite stocks held by Energy ETFs and mutual funds. It earns our Attractive rating. Over the past four years, National Oilwell has grown after-tax profits ( NOPAT ) by 11% compounded annually. The company earns a return on invested capital ( ROIC ) of 8% and has generated over $1.1 billion in free cash flow on a trailing twelve-month basis. Across the energy industry, share prices have been collapsing over the past year, but National Oilwell’s business does not deserve the decline in its shares. At its current price of $38/share, NOV has a price to economic book value ( PEBV ) ratio of 0.6. This ratio implies that the market expects National Oilwell’s profits to permanently decline by 40% from current levels. If National Oilwell can grow NOPAT by just 1% compounded annually over the next five years , the stock is worth $80/share today – a 110% upside. It’s easy to see just how low the expectations baked into NOV have become. Tesoro Corporation (NYSE: TSO ) is one of our least favorite stocks held by Energy ETFs and mutual funds and earns our Very Dangerous rating. Since 2011, Tesoro’s NOPAT has declined by 1% compounded annually despite the oil industry witnessing high growth rates prior to 2014. Over the same timeframe, Tesoro’s ROIC has fallen to 6% from 12%. Despite the deterioration of the business, TSO has increased nearly 400% since 2011, which has left shares greatly overvalued. To justify its current price of $102/share, Tesoro must grow NOPAT by 10% compounded annually for the next 11 years. This scenario seems rather unlikely given that NOPAT has only declined lately. With such lofty expectations embedded in the stock price, it’s easy to see why Tesoro is one of our least favorite Energy stocks. Figures 3 and 4 show the rating landscape of all Energy ETFs and mutual funds. Figure 3: Separating the Best ETFs From the Worst ETFs (click to enlarge) Sources: New Constructs, LLC and company filings Figure 4: Separating the Best Mutual Funds From the Worst Mutual Funds (click to enlarge) Sources: New Constructs, LLC and company filings D isclosure: David Trainer and Thaxston McKee receive no compensation to write about any specific stock, sector or theme.

Best And Worst Q3’15: Energy ETFs, Mutual Funds And Key Holdings

Summary The Energy sector ranks last in Q3’15. Based on an aggregation of ratings of 20 ETFs and 90 mutual funds in the Energy sector. OIH is our top-rated Energy ETF and FSESX is our top-rated Energy mutual fund. The Energy sector ranks last out of the 10 sectors as detailed in our Q3’15 Sector Ratings for ETFs and Mutual Funds report. It gets our Dangerous rating, which is based on aggregation of ratings of 20 ETFs and 90 mutual funds in the Energy sector. See a recap of our Q2’15 Sector Ratings here . Figures 1 and 2 show the five best and worst-rated ETFs and mutual funds in the sector. Not all Energy sector ETFs and mutual funds are created the same. The number of holdings varies widely (from 25 to 163). This variation creates drastically different investment implications and, therefore, ratings. Investors seeking exposure to the Energy sector should buy one of the Attractive-or-better rated ETFs or mutual funds from Figures 1 and 2. Figure 1: ETFs with the Best & Worst Ratings – Top 5 (click to enlarge) * Best ETFs exclude ETFs with TNAs less than $100 million for inadequate liquidity. Sources: New Constructs, LLC and company filings The PowerShares Dynamic Oil & Gas Services Portfolio ETF (NYSEARCA: PXJ ) is excluded from Figure 1 because its total net assets are below $100 million and do not meet our liquidity minimums. Figure 2: Mutual Funds with the Best & Worst Ratings – Top 5 (click to enlarge) * Best mutual funds exclude funds with TNAs less than $100 million for inadequate liquidity. Sources: New Constructs, LLC and company filings The Market Vectors Oil Services ETF (NYSEARCA: OIH ) is the top-rated Energy ETF and the Fidelity Select Energy Service Portfolio (MUTF: FSESX ) is the top-rated Energy mutual fund. OIH earns our Attractive rating and FSESX earns our Neutral rating. The PowerShares DWA Energy Momentum Portfolio ETF (NYSEARCA: PXI ) is the worst-rated Energy ETF and the Saratoga Energy & Basic Materials Fund (MUTF: SBMBX ) is the worst-rated energy mutual fund. Both earn a Very Dangerous rating. 187 stocks of the 3000+ we cover are classified as energy stocks. National-Oilwell Varco (NYSE: NOV ) is one of our favorite stocks held by Energy ETFs and mutual funds and earns our Very Attractive rating. Since 2009, National Oilwell has grown after-tax profit ( NOPAT ) by 11% compounded annually. National Oilwell has a return on invested capital ( ROIC ) of 10% and over $4 billion in free cash flow on a trailing twelve-month basis. Due to the recent decline in energy-related securities, NOV can be purchased well below its fair value. At its current price of ~$43/share, NOV has a price to economic book value ( PEBV ) ratio of 0.6. This ratio implies that the market expects National Oilwell’s NOPAT to permanently decline by 40%. If National Oilwell can grow NOPAT by just 3% compounded annually for the next six years , the stock is worth $80/share today – an 86% upside. Marathon Petroleum Corp (NYSE: MPC ) is one of our least favorite stocks held by Energy ETFs and mutual funds and earns our Very Dangerous rating. Marathon’s NOPAT has declined from $3.3 billion in 2011 to -$589 million in 2014. ROIC has also fallen from 15% to 1%. Investors not reading the footnotes would be unaware of the deteriorating business fundamentals. Due to a change in LIFO inventory value we remove $3.4 billion from Marathon’s 2014 income statement. Without making this adjustment the market has been led to believe that profits actually grew in 2014. The disconnect between NOPAT and net income could explain why MPC is up 39% over the last year despite the Energy sector being down 27%. To justify its now overvalued price of $56/share, MPC must grow revenues by 16% compounded annually for the next 13 years while also raising its current NOPAT margin from -0.6% to 2.5%. Marathon has only grown revenue by 8% compounded annually since 2011. Expecting Marathon to double its revenue growth in a weak Energy environment and maintain that high level for over a decade seems rather optimistic. Figures 3 and 4 show the rating landscape of all Energy ETFs and mutual funds. Figure 3: Separating the Best ETFs From the Worst ETFs (click to enlarge) Sources: New Constructs, LLC and company filings Figure 4: Separating the Best Mutual Funds From the Worst Mutual Funds (click to enlarge) Sources: New Constructs, LLC and company filings D isclosure: David Trainer and Allen Jackson receive no compensation to write about any specific stock, sector or theme. Disclosure: I/we have no positions in any stocks mentioned, and no plans to initiate any positions within the next 72 hours. (More…) I wrote this article myself, and it expresses my own opinions. I am not receiving compensation for it. I have no business relationship with any company whose stock is mentioned in this article.