Scalper1 News
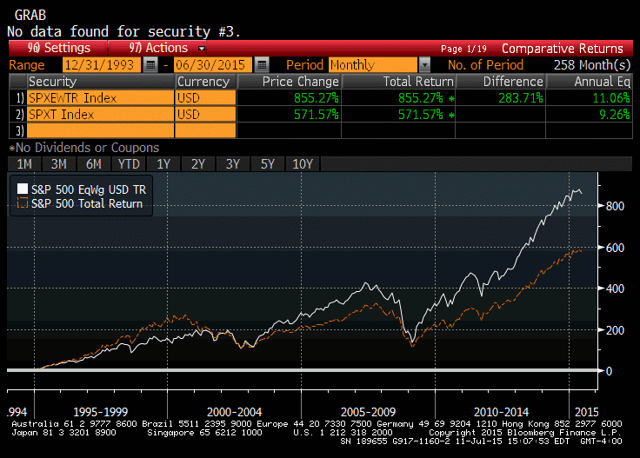
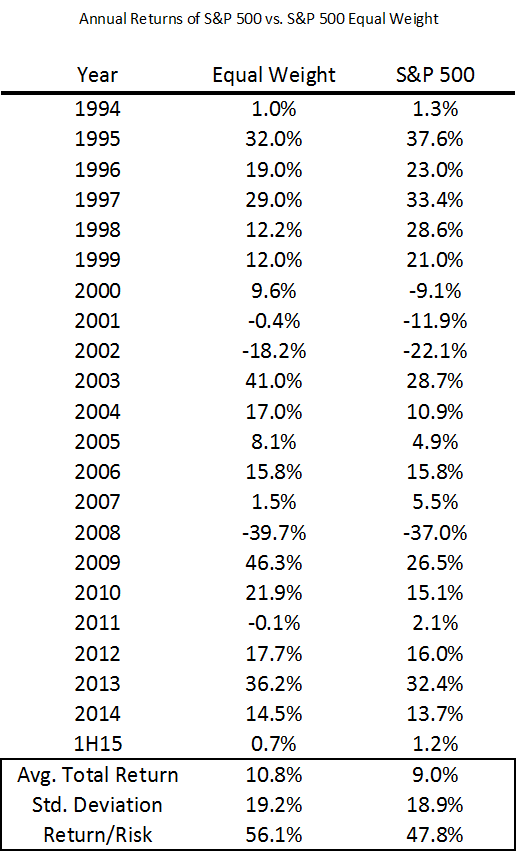
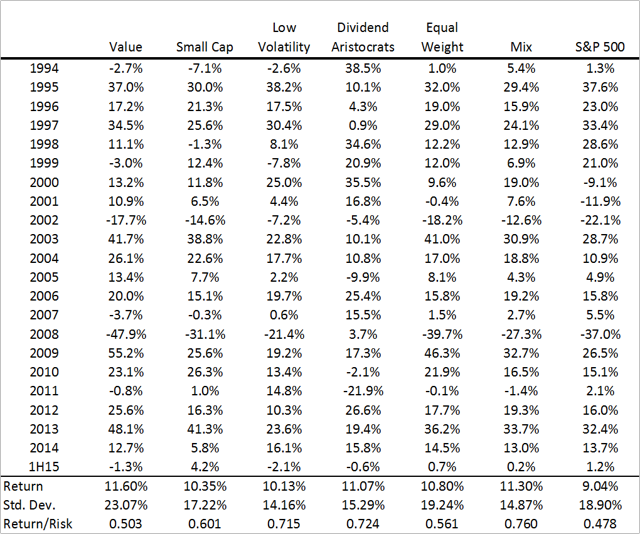
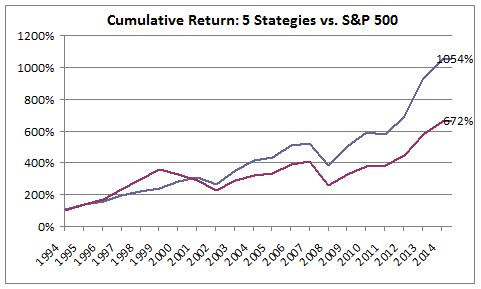 Summary •In a series of articles in December 2014, I highlighted five buy-and-hold strategies that have historically outperformed the S&P 500 (SPY). •Stock ownership by U.S. households is low and falling even as the barriers to entering the market have been greatly reduced. •Investors should understand simple and easy to implement strategies that have been shown to outperform the market over long time intervals. •The final of five strategies I will revisit in this series of articles is equal weighing, a contrarian “buy low, sell high” approach to index rebalancing. In a series of articles in December 2014, I demonstrated five buy-and-hold strategies – size, value, low volatility, dividend growth, and equal weighting, that have historically outperformed the S&P 500 (NYSEARCA: SPY ). I covered an update to the size factor published on Wednesday, posted an update to the value factor on Thursday, covered the Low Volatility Anomaly on Friday, and tackled the Dividend Aristocrats yesterday . In that series, I demonstrated that while technological barriers and costs to market access have been falling, the number of households that own stocks in non-retirement accounts has been falling as well. Less that 14% of U.S. households directly own stocks, which is less than half of the amount of households that own dogs or cats , and less than half of the proportion of households that own guns . The percentage of households that directly own stocks is even less than the percentage of households that have Netflix or Hulu . The strategies I discussed in this series are low cost ways of getting broadly diversified domestic equity exposure with factor tilts that have generated long-run structural alpha. I want to keep these investor topics in front of the Seeking Alpha readership, so I will re-visit these principles with a discussion of the first half returns of these strategies in a series of five articles over the next five days. Reprisals of these articles will allow me to continually update the long-run returns of these strategies for the readership. Equal Weighting The S&P 500 Equal Weight Index is a version of the S&P 500 where the constituents are equal weighted as opposed to the traditional market capitalization weighting of the benchmark gauge. Guggenheim S&P 500 Equal Weight ETF (NYSEARCA: RSP ) replicates this alternative weight index. When the equal-weighted version of the index is rebalanced quarterly to return to equal weights, constituents which have underperformed are purchased and constituents which have outperformed are reduced, a contrarian strategy that has produced excess returns relative to the capitalization-weighted S&P 500 index over long-time intervals. Equal-weighting also gives an investor a greater average exposure to smaller capitalization stocks, a risk factor, detailed in the first article in this series , for which investors have historically been compensated with higher average returns. The composition of the equal-weighted index is more consistent with mid-cap stocks, which have historically outperformed large caps. The graph below shows the cumulative return of the S&P 500 Equal Weight Index relative to the cumulative return of the capitalization-weighted S&P 500 Index. (click to enlarge) Research by Plyakha, Uppal, and Vilkov (2012) puts some data behind my narrative that the size factor and contrarian rebalancing drive alpha in equal weighting strategies. Their analysis found that the higher systematic return of equal weighting relative to capitalization-weighted portfolios arose from relatively higher exposure to the size and value factors described in the first two articles in this series. The higher alpha of the equal-weighted strategy was determined to arise from periodic rebalancing, a contrarian strategy that exploits time-series properties of stock returns. The S&P 500 currently has a 17.1% weighting towards its ten largest constituents. Over one-sixth of the value of the broad market gauge is attributable to one-fiftieth of its components. To demonstrate the value of the size factor to equal-weighting, we should see the S&P 500 outperform the S&P 100 over the same twenty-year time interval. The S&P 100 Index, the hundred largest constituents of the S&P 500, trailing the S&P 500 by 11bps per year. If the contrarian rebalancing in equal-weighting also creates alpha, we should see an equal-weighted S&P 100 outperform a capitalization-weighted S&P 100. While I do not have data on the total return of an equal-weighted S&P 100 Index for 20 years, I do have fourteen years of data that show that an equal weighted index would have outperformed the capitalization-weighted index by 1.77% per year since the beginning of 2001. When I have previously discussed equal-weighting the S&P 500, some readers have commented that this is simply a mid-cap strategy, owing all of its outperformance to the size factor, but I hope this data shows that the contrarian re-balancing is also an important piece of the structural alpha gleaned through equal-weighting. Some of the most powerful ideas in finance are the easiest and simplest to implement. At its core, equal weighting overcomes the bias inherent in the capitalization-weighted benchmark index that forces investors to hold larger proportions of stocks that have risen in value. Periodic rebalancing allows the strategy to “buy low and sell high”, still the most tried and true way of making money in financial markets. Each of the five strategies I have outlined in this series share this notion that sometimes the best ideas are the simplest. I hope long-term buy-and-hold investors consider the size, value, low volatility, consistent dividend growth, and equal weighting approaches that have been demonstrated to outperform the market. Each of these factor tilts gleans their outperformance from slightly different risk factors, which should generate risk-adjusted outperformance over multiple business cycles. Low Volatility will have better performance in the down-turn, the size and value factors should generate outperformance in the recovery. I conclude this series of articles with a combined twenty plus year history of their total returns. The mix columns is an equal-weighting of the five different strategies. (You now also know that periodic rebalancing of these different strategies could enhance the alpha generated.) Over twenty-years, these strategies each produced higher absolute returns than the S&P 500 and higher average returns per unit of risk. Combining these strategies would have generated a 2.1% annualized outperformance with less than 90% of the variability of returns. A 2.1% annualized outperformance over this long time frame would have meant that investors who employed these strategies for twenty years would have had nearly a 50% higher nest egg today. (click to enlarge) With the return series side-by-side, readers should notice that Low Volatility stocks and the Dividend Aristocrats outperformed in weak equity years (2000-2002, 2008). Value stocks and small cap stocks have outperformed in the early stages of economic recoveries (2003, 2009). Understanding how these five strategies perform in different parts of the business cycle is a key towards value-accretive asset allocation. Thanks to all of my readers who contributed thoughtful comments on this series. Long-time readers may be surprised that momentum, a topic I have covered in many past articles, did not make it into my five strategies. The paired switching strategies in my momentum articles have also “beat the market”, but did so with a different source of alpha than the “buy and hold” approaches that I wished to spotlight in this series. Future work will follow-up on reader questions emanating from theses articles. Additional articles will also focus on combinations of these strategies that could well serve long-term investors. Disclaimer: My articles may contain statements and projections that are forward-looking in nature, and therefore inherently subject to numerous risks, uncertainties and assumptions. While my articles focus on generating long-term risk-adjusted returns, investment decisions necessarily involve the risk of loss of principal. Individual investor circumstances vary significantly, and information gleaned from my articles should be applied to your own unique investment situation, objectives, risk tolerance, and investment horizon. Disclosure: I am/we are long RSP, SPY. (More…) I wrote this article myself, and it expresses my own opinions. I am not receiving compensation for it (other than from Seeking Alpha). I have no business relationship with any company whose stock is mentioned in this article. Scalper1 News
Scalper1 News