Scalper1 News
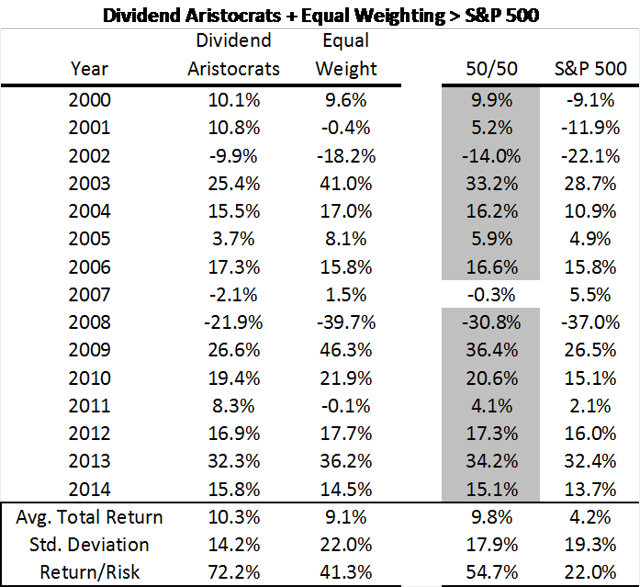 Summary Two factor tilts from the S&P 500 – the Dividend Aristocrats and Equal Weighting – have historically beat the benchmark gauge. Combining these two indices in equal proportions has beat the S&P 500 in all but one year of the twenty-first century. Strong performance in different market environments helps the combination outperform through the business cycle. In a recent series of articles, I highlighted five strategies for buy-and-hold investors that have historically beat the market. The Dividend Aristocrats , S&P 500 constituents which have paid increasing levels of dividends for at least twenty-five consecutive years, have produced a return profile exceeding the broader market by 2.5% per annum over the past twenty years while exhibiting only three-quarters of the return volatility. The S&P 500 Dividend Aristocrats ETF (NYSEARCA: NOBL ) closely replicates the Dividend Aristocrats. The S&P 500 Equal Weight Index is a version of the S&P 500 where the constituents are equal weighted as opposed to the traditional market capitalization weighting of the benchmark gauge. Guggenheim S&P 500 Equal Weight ETF (NYSEARCA: RSP ) replicates this alternative weight index. When the equal-weighted version of the index is rebalanced quarterly to return to equal weights, constituents which have underperformed are purchased and constituents which have outperformed are reduced, a contrarian strategy that has produced excess returns relative to the capitalization-weighted S&P 500 index over long-time intervals. Equal-weighting also gives an investor a greater average exposure to smaller capitalization stocks, a risk factor for which investors have historically been compensated with higher average returns. Index returns for the Dividend Aristocrats and the Equal Weight Index are detailed below. I compare a 50-50 weight of the two indices versus the total return of the S&P 500. Source: Standard and Poor’s; Bloomberg The Dividend Aristocrats produced a disproportionate amount of their relative excess return versus the S&P 500 in falling markets (see 2002, 2008), and the equal-weighted index produced its relative excess returns in rising markets (see 2003, 2009), combining their return profiles produces a risk profile that exceeds the broader market with less variability of returns . Combining these two strategies in equal proportions has bested the S&P 500 in fourteen of the past fifteen years. Singularly, the Dividend Aristocrats have beat the S&P 500 in eleven of the past fifteen years, and the Equal Weighted Index has beat the S&P 500 in twelve of fifteen years, but combining the two passive strategies in equal proportions has led to even more consistent outperformance. How good has the outperformance of this strategy been? Any active fund manager beating the market for 14 of the last 15 years would have made himself a lot of money. The geometric average return of this strategy (+9.81% from 2000-2014) beat the S&P 500 (+4.24%) by nearly 6% per year while exhibiting lower return variability. Over this historically weak period for stock returns, a dollar invested in this strategy in 2000 would be worth $4.07 today while a dollar invested in the S&P 500 would be worth less than half that figure, just $1.86, even with stocks near all-time highs. Critics of this strategy would point out that from 1990-1999, the S&P 500 outperformed a fifty/fifty mix of the Dividend Aristocrats and the Equal Weighted Index by 2.92% per year. I would counter that this outperformance by the broad market gauge was entirely generated by the S&P 500 returns in 1998 and 1999. High flying returns of tech stocks, which were not represented in the Dividend Aristocrats because of the long tenor inclusion rules, benefited the capitalization-weighted index. These two years marked the peak of the tech bubble, which subsequently unwound itself between 2000 and 2002 when the market produced three negative returns in a row. Taking out 1998 and 1999 from this dataset, and a combination of the Dividend Aristocrats and Equal Weighted Index still outperformed the S&P 500 between 1990 and 1997 (geometric average return of 16.98% vs. 16.63%) with slightly lower variability of returns. I am pretty confident in saying that over the next fifteen years, a combination of the Dividend Aristocrats and the Equal Weighted Index will have lower variability of returns than the broader market. Because the Dividend Aristocrats Index is populated by companies that are able to return increasing levels of cash to shareholders through both the peaks and valleys of the business cycle, this index has lower drawdowns in weak markets. In each of the years that the S&P 500 produced negative returns in this sample period, the Dividend Aristocrats outperformed. Combining the Dividend Aristocrats with the equal weighted index, which tends to outperform the market when it is sharply rising, provides a diversification benefit. If we believe that this strategy will have lower relative risk to the broad market, will this strategy continue to generate excess returns? I believe that the Dividend Aristocrats will produce excess returns when adjusted for their lower risk over long-time intervals. This strategy effectively overweights these high quality companies, capturing the Low Volatility Anomaly , and missing S&P 500 constituents who go out of business. I am sure that some astute readers will note that the Dividend Aristocrats have outperformed the combination with the Equal Weighted Index over the entire dataset. While their risk-adjusted performance will remain strong, I do not expect that low volatility stocks, like the Dividend Aristocrats, will necessarily continue to outperform the broader market on an absolute basis. The Dividend Aristocrats have now outperformed the S&P 500 for six of the past seven years, and the market might be catching up to the idea that lower risk stocks are worth a premium, especially in uncertain market environments and a yield-starved world. Equal-weighting the stock constituents provides an uncorrelated source of alpha. As I have written before, equal weighting the S&P 500 constituents is an alpha-generative contrarian strategy that also more effectively captures the “small(er) cap premium” than the capitalization weighted S&P 500, and I think that this part of the strategy will be an increasing component of its outperformance prospectively. For passive investors who want broad market exposure, understanding that changing your index weightings to a combination that overweights dividend growth stocks and equal weights the broad market benchmark has historically produced higher average returns with lower variability of returns. That’s the alpha we are seeking. Author’s Postscript A previous version of this article has index return data back to 1990. Disclaimer : My articles may contain statements and projections that are forward-looking in nature, and therefore inherently subject to numerous risks, uncertainties and assumptions. While my articles focus on generating long-term risk-adjusted returns, investment decisions necessarily involve the risk of loss of principal. Individual investor circumstances vary significantly, and information gleaned from my articles should be applied to your own unique investment situation, objectives, risk tolerance, and investment horizon. Disclosure: The author is long RSP, NOBL. (More…) The author wrote this article themselves, and it expresses their own opinions. The author is not receiving compensation for it (other than from Seeking Alpha). The author has no business relationship with any company whose stock is mentioned in this article. Scalper1 News
Scalper1 News