Tag Archives: nysearcarsp

5 Ways To Beat The Market: Part 5 Revisited

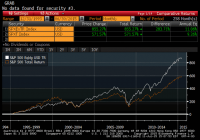
Summary •In a series of articles in December 2014, I highlighted five buy-and-hold strategies that have historically outperformed the S&P 500 (SPY). •Stock ownership by U.S. households is low and falling even as the barriers to entering the market have been greatly reduced. •Investors should understand simple and easy to implement strategies that have been shown to outperform the market over long time intervals. •The final of five strategies I will revisit in this series of articles is equal weighing, a contrarian “buy low, sell high” approach to index rebalancing. In a series of articles in December 2014, I demonstrated five buy-and-hold strategies – size, value, low volatility, dividend growth, and equal weighting, that have historically outperformed the S&P 500 (NYSEARCA: SPY ). I covered an update to the size factor published on Wednesday, posted an update to the value factor on Thursday, covered the Low Volatility Anomaly on Friday, and tackled the Dividend Aristocrats yesterday . In that series, I demonstrated that while technological barriers and costs to market access have been falling, the number of households that own stocks in non-retirement accounts has been falling as well. Less that 14% of U.S. households directly own stocks, which is less than half of the amount of households that own dogs or cats , and less than half of the proportion of households that own guns . The percentage of households that directly own stocks is even less than the percentage of households that have Netflix or Hulu . The strategies I discussed in this series are low cost ways of getting broadly diversified domestic equity exposure with factor tilts that have generated long-run structural alpha. I want to keep these investor topics in front of the Seeking Alpha readership, so I will re-visit these principles with a discussion of the first half returns of these strategies in a series of five articles over the next five days. Reprisals of these articles will allow me to continually update the long-run returns of these strategies for the readership. Equal Weighting The S&P 500 Equal Weight Index is a version of the S&P 500 where the constituents are equal weighted as opposed to the traditional market capitalization weighting of the benchmark gauge. Guggenheim S&P 500 Equal Weight ETF (NYSEARCA: RSP ) replicates this alternative weight index. When the equal-weighted version of the index is rebalanced quarterly to return to equal weights, constituents which have underperformed are purchased and constituents which have outperformed are reduced, a contrarian strategy that has produced excess returns relative to the capitalization-weighted S&P 500 index over long-time intervals. Equal-weighting also gives an investor a greater average exposure to smaller capitalization stocks, a risk factor, detailed in the first article in this series , for which investors have historically been compensated with higher average returns. The composition of the equal-weighted index is more consistent with mid-cap stocks, which have historically outperformed large caps. The graph below shows the cumulative return of the S&P 500 Equal Weight Index relative to the cumulative return of the capitalization-weighted S&P 500 Index. (click to enlarge) Research by Plyakha, Uppal, and Vilkov (2012) puts some data behind my narrative that the size factor and contrarian rebalancing drive alpha in equal weighting strategies. Their analysis found that the higher systematic return of equal weighting relative to capitalization-weighted portfolios arose from relatively higher exposure to the size and value factors described in the first two articles in this series. The higher alpha of the equal-weighted strategy was determined to arise from periodic rebalancing, a contrarian strategy that exploits time-series properties of stock returns. The S&P 500 currently has a 17.1% weighting towards its ten largest constituents. Over one-sixth of the value of the broad market gauge is attributable to one-fiftieth of its components. To demonstrate the value of the size factor to equal-weighting, we should see the S&P 500 outperform the S&P 100 over the same twenty-year time interval. The S&P 100 Index, the hundred largest constituents of the S&P 500, trailing the S&P 500 by 11bps per year. If the contrarian rebalancing in equal-weighting also creates alpha, we should see an equal-weighted S&P 100 outperform a capitalization-weighted S&P 100. While I do not have data on the total return of an equal-weighted S&P 100 Index for 20 years, I do have fourteen years of data that show that an equal weighted index would have outperformed the capitalization-weighted index by 1.77% per year since the beginning of 2001. When I have previously discussed equal-weighting the S&P 500, some readers have commented that this is simply a mid-cap strategy, owing all of its outperformance to the size factor, but I hope this data shows that the contrarian re-balancing is also an important piece of the structural alpha gleaned through equal-weighting. Some of the most powerful ideas in finance are the easiest and simplest to implement. At its core, equal weighting overcomes the bias inherent in the capitalization-weighted benchmark index that forces investors to hold larger proportions of stocks that have risen in value. Periodic rebalancing allows the strategy to “buy low and sell high”, still the most tried and true way of making money in financial markets. Each of the five strategies I have outlined in this series share this notion that sometimes the best ideas are the simplest. I hope long-term buy-and-hold investors consider the size, value, low volatility, consistent dividend growth, and equal weighting approaches that have been demonstrated to outperform the market. Each of these factor tilts gleans their outperformance from slightly different risk factors, which should generate risk-adjusted outperformance over multiple business cycles. Low Volatility will have better performance in the down-turn, the size and value factors should generate outperformance in the recovery. I conclude this series of articles with a combined twenty plus year history of their total returns. The mix columns is an equal-weighting of the five different strategies. (You now also know that periodic rebalancing of these different strategies could enhance the alpha generated.) Over twenty-years, these strategies each produced higher absolute returns than the S&P 500 and higher average returns per unit of risk. Combining these strategies would have generated a 2.1% annualized outperformance with less than 90% of the variability of returns. A 2.1% annualized outperformance over this long time frame would have meant that investors who employed these strategies for twenty years would have had nearly a 50% higher nest egg today. (click to enlarge) With the return series side-by-side, readers should notice that Low Volatility stocks and the Dividend Aristocrats outperformed in weak equity years (2000-2002, 2008). Value stocks and small cap stocks have outperformed in the early stages of economic recoveries (2003, 2009). Understanding how these five strategies perform in different parts of the business cycle is a key towards value-accretive asset allocation. Thanks to all of my readers who contributed thoughtful comments on this series. Long-time readers may be surprised that momentum, a topic I have covered in many past articles, did not make it into my five strategies. The paired switching strategies in my momentum articles have also “beat the market”, but did so with a different source of alpha than the “buy and hold” approaches that I wished to spotlight in this series. Future work will follow-up on reader questions emanating from theses articles. Additional articles will also focus on combinations of these strategies that could well serve long-term investors. Disclaimer: My articles may contain statements and projections that are forward-looking in nature, and therefore inherently subject to numerous risks, uncertainties and assumptions. While my articles focus on generating long-term risk-adjusted returns, investment decisions necessarily involve the risk of loss of principal. Individual investor circumstances vary significantly, and information gleaned from my articles should be applied to your own unique investment situation, objectives, risk tolerance, and investment horizon. Disclosure: I am/we are long RSP, SPY. (More…) I wrote this article myself, and it expresses my own opinions. I am not receiving compensation for it (other than from Seeking Alpha). I have no business relationship with any company whose stock is mentioned in this article.
Dividend Aristocrats + Equal Weighting Has Beat Market For 14 Of 15 Years

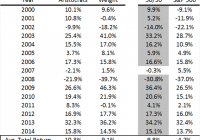
Summary Two factor tilts from the S&P 500 – the Dividend Aristocrats and Equal Weighting – have historically beat the benchmark gauge. Combining these two indices in equal proportions has beat the S&P 500 in all but one year of the twenty-first century. Strong performance in different market environments helps the combination outperform through the business cycle. In a recent series of articles, I highlighted five strategies for buy-and-hold investors that have historically beat the market. The Dividend Aristocrats , S&P 500 constituents which have paid increasing levels of dividends for at least twenty-five consecutive years, have produced a return profile exceeding the broader market by 2.5% per annum over the past twenty years while exhibiting only three-quarters of the return volatility. The S&P 500 Dividend Aristocrats ETF (NYSEARCA: NOBL ) closely replicates the Dividend Aristocrats. The S&P 500 Equal Weight Index is a version of the S&P 500 where the constituents are equal weighted as opposed to the traditional market capitalization weighting of the benchmark gauge. Guggenheim S&P 500 Equal Weight ETF (NYSEARCA: RSP ) replicates this alternative weight index. When the equal-weighted version of the index is rebalanced quarterly to return to equal weights, constituents which have underperformed are purchased and constituents which have outperformed are reduced, a contrarian strategy that has produced excess returns relative to the capitalization-weighted S&P 500 index over long-time intervals. Equal-weighting also gives an investor a greater average exposure to smaller capitalization stocks, a risk factor for which investors have historically been compensated with higher average returns. Index returns for the Dividend Aristocrats and the Equal Weight Index are detailed below. I compare a 50-50 weight of the two indices versus the total return of the S&P 500. Source: Standard and Poor’s; Bloomberg The Dividend Aristocrats produced a disproportionate amount of their relative excess return versus the S&P 500 in falling markets (see 2002, 2008), and the equal-weighted index produced its relative excess returns in rising markets (see 2003, 2009), combining their return profiles produces a risk profile that exceeds the broader market with less variability of returns . Combining these two strategies in equal proportions has bested the S&P 500 in fourteen of the past fifteen years. Singularly, the Dividend Aristocrats have beat the S&P 500 in eleven of the past fifteen years, and the Equal Weighted Index has beat the S&P 500 in twelve of fifteen years, but combining the two passive strategies in equal proportions has led to even more consistent outperformance. How good has the outperformance of this strategy been? Any active fund manager beating the market for 14 of the last 15 years would have made himself a lot of money. The geometric average return of this strategy (+9.81% from 2000-2014) beat the S&P 500 (+4.24%) by nearly 6% per year while exhibiting lower return variability. Over this historically weak period for stock returns, a dollar invested in this strategy in 2000 would be worth $4.07 today while a dollar invested in the S&P 500 would be worth less than half that figure, just $1.86, even with stocks near all-time highs. Critics of this strategy would point out that from 1990-1999, the S&P 500 outperformed a fifty/fifty mix of the Dividend Aristocrats and the Equal Weighted Index by 2.92% per year. I would counter that this outperformance by the broad market gauge was entirely generated by the S&P 500 returns in 1998 and 1999. High flying returns of tech stocks, which were not represented in the Dividend Aristocrats because of the long tenor inclusion rules, benefited the capitalization-weighted index. These two years marked the peak of the tech bubble, which subsequently unwound itself between 2000 and 2002 when the market produced three negative returns in a row. Taking out 1998 and 1999 from this dataset, and a combination of the Dividend Aristocrats and Equal Weighted Index still outperformed the S&P 500 between 1990 and 1997 (geometric average return of 16.98% vs. 16.63%) with slightly lower variability of returns. I am pretty confident in saying that over the next fifteen years, a combination of the Dividend Aristocrats and the Equal Weighted Index will have lower variability of returns than the broader market. Because the Dividend Aristocrats Index is populated by companies that are able to return increasing levels of cash to shareholders through both the peaks and valleys of the business cycle, this index has lower drawdowns in weak markets. In each of the years that the S&P 500 produced negative returns in this sample period, the Dividend Aristocrats outperformed. Combining the Dividend Aristocrats with the equal weighted index, which tends to outperform the market when it is sharply rising, provides a diversification benefit. If we believe that this strategy will have lower relative risk to the broad market, will this strategy continue to generate excess returns? I believe that the Dividend Aristocrats will produce excess returns when adjusted for their lower risk over long-time intervals. This strategy effectively overweights these high quality companies, capturing the Low Volatility Anomaly , and missing S&P 500 constituents who go out of business. I am sure that some astute readers will note that the Dividend Aristocrats have outperformed the combination with the Equal Weighted Index over the entire dataset. While their risk-adjusted performance will remain strong, I do not expect that low volatility stocks, like the Dividend Aristocrats, will necessarily continue to outperform the broader market on an absolute basis. The Dividend Aristocrats have now outperformed the S&P 500 for six of the past seven years, and the market might be catching up to the idea that lower risk stocks are worth a premium, especially in uncertain market environments and a yield-starved world. Equal-weighting the stock constituents provides an uncorrelated source of alpha. As I have written before, equal weighting the S&P 500 constituents is an alpha-generative contrarian strategy that also more effectively captures the “small(er) cap premium” than the capitalization weighted S&P 500, and I think that this part of the strategy will be an increasing component of its outperformance prospectively. For passive investors who want broad market exposure, understanding that changing your index weightings to a combination that overweights dividend growth stocks and equal weights the broad market benchmark has historically produced higher average returns with lower variability of returns. That’s the alpha we are seeking. Author’s Postscript A previous version of this article has index return data back to 1990. Disclaimer : My articles may contain statements and projections that are forward-looking in nature, and therefore inherently subject to numerous risks, uncertainties and assumptions. While my articles focus on generating long-term risk-adjusted returns, investment decisions necessarily involve the risk of loss of principal. Individual investor circumstances vary significantly, and information gleaned from my articles should be applied to your own unique investment situation, objectives, risk tolerance, and investment horizon. Disclosure: The author is long RSP, NOBL. (More…) The author wrote this article themselves, and it expresses their own opinions. The author is not receiving compensation for it (other than from Seeking Alpha). The author has no business relationship with any company whose stock is mentioned in this article.

If I Could Invest In Only One Fund . . .

Which fund is my #1 pick out of 7,000 mutual funds? Attributes of my top fund: low fee, low turnover, low risk of strategy obsolescence. Value beats Growth; Small Cap beats Large Cap. If I could invest in only a single fund . . . . . . and I had to invest all of my equity investment dollars in this fund . . . and I could only own this single fund for the rest of my life . . . which fund would I pick? Given that there are roughly 7,000 mutual funds available in the U.S. today, the above scenario of having to invest in only a single fund is admittedly not realistic. However, if you can come up with a good answer for it then you have probably found yourself a fund that deserves a significant share of your investment dollars. For me, I am looking for a fund that has a combination of the following attributes: 1. A time-tested, consistent and successful investment strategy based on empirical evidence of what actually works in investing. The strategy must also have low risk of obsolescence over time. (Thus, it must be a numbers-driven strategy). 2. Broad diversification – I can’t have the risk of too much money in a single stock 3. Low fees – I want a very cheap fund that is an excellent business proposition. 4. Tax efficiency – I need a fund that has very low turnover (trading)-and consequently high tax efficiency and very low drag on returns. Here is my personal investment profile: I am a long-term oriented and risk tolerant investor looking to maximize wealth over decades, not in any one year. Given my investment objective and my fairly high tolerance for risk, the fund I would choose for myself out of the 7,000 possibilities if I were able to invest in only one fund for the rest of my life is the Dimensional Small Cap Value Portfolio (MUTF: DFSVX ). Why does this particular fund top my list? There are many reasons, but here are my biggest 5: 1. Value Beats Growth The first reason is the fund’s value focus. Investors everywhere should understand a basic historical fact of stock markets: Value stocks-stocks that are cheap by financial measures-have outperformed growth stocks, their more expensive, glamorous and news-worthy cousins, by a wide margin. This is true both in the U.S. and in overseas stock markets. Does value outperform growth every year? No. Is there any guarantee that value will outperform growth in the future? No. But that’s a risk I’ll happily take. The data are compelling. And this Dimensional fund takes value seriously: the average price-to-book value ratio of its individual holdings is a mere 1.16x. It’s chock full of cheap stocks. 2. Small-Cap Beats Large-Cap The second reason is the fund’s small-cap focus. Here’s another thing all investors should know: it is a matter of record that historically small company stocks have delivered better investment performance than large company stocks, albeit with more volatility. For me, the extra volatility is ok. Remember, I’m a long-term investor looking to maximize my wealth over the coming decades-not in any one year. Any big swoons will just be opportunities for me to increase my small-cap value holdings. And as with the value versus growth comparison, the phenomenon of small-caps outperforming large-caps is true in both U.S. and overseas stock markets. Do small-caps outperform large-caps every year? No. (In fact, U.S. small-caps lagged large-caps in 2014-after beating them handily in 2013. Does the fact that large-caps beat small caps in 2014 do anything to diminish my confidence in the long-term outlook for small caps? No.) 3. Broad Diversification The Dimensional Small Cap Value Portfolio is also very well diversified-much more so than the vast majority of small-cap funds. The fund currently holds more than 1,200 stocks, thereby greatly reducing the possibility that the performance of any single stock will dramatically affect overall fund performance. It is important to understand that the fund’s objective is to efficiently capture the returns of the world’s top performing equity segment-small-cap value stocks-not hit a home run on any single stock. The fund’s numerous underlying holdings enable it to do just that. 4. Consistency of Strategy and Low Risk of Obsolescence If I’m going to be locked into an investment for the next 50 years (I hope), I want it to have a consistent, reliable, data-driven strategy that does not depend on the investment acumen of any human (or group of humans). My chosen fund is managed according to quantitative factors. Stocks enter or exit the portfolio based on their quantitative value or size characteristics, not because of a judgment someone had to make. It is of course true that humans created Dimensional’s investing algorithms, but now the strategy has 30-plus years of successful performance history under its belt and requires minimal tinkering (in my opinion). 5. Very Low Costs It is critical for investors to mind the costs of their funds. The range of expenses among funds is very wide and fees are often disclosed only deep in mind-numbing fund prospectuses. The net expense ratio of my chosen fund is a mere 0.52%, however, which is a significant discount to the average fund. In addition, my chosen fund has annual turnover of only 14%. Its light touch on trading keeps a lid on costs and makes the fund more tax-efficient as well. Portfolio turnover (buying and selling) creates costs for a fund but such trading costs are not disclosed explicitly and cannot be predicted accurately. Many mutual fund managers turn their funds over in excess of 100% per year (i.e. only hold the average stock for one year), and in the process rack up huge costs that are passed through to the underlying investors. In some cases investors may be squandering 2%-3% per year of performance right out of the gate simply by owning a high-turnover fund. To sum it up, Dimensional Small Cap Value Portfolio has the right combination of attributes that make it my top pick out of 7,000 funds if I were required to put all of my money into a single fund for the rest of my life. Investors considering taking a similar approach to me but with ETFs instead of mutual funds may want to check out the iShares Russell 2000 Value ETF (NYSEARCA: IWN ) or the iShares S&P Small Cap 600 Value ETF (NYSEARCA: IJS ). For an option that has a more large-cap focus but useful rebalancing methodology, the Guggenheim S&P 500 Equal Weight ETF (NYSEARCA: RSP ) might be worth some consideration. Investors should take note that the average market cap of the holdings in each of these funds is substantially higher than that of the holdings of the DFA Small Cap Value Portfolio, however. To learn more about Dimensional Funds and how we employ them in client portfolios, please visit us at www.orionportfolios.com .