Scalper1 News
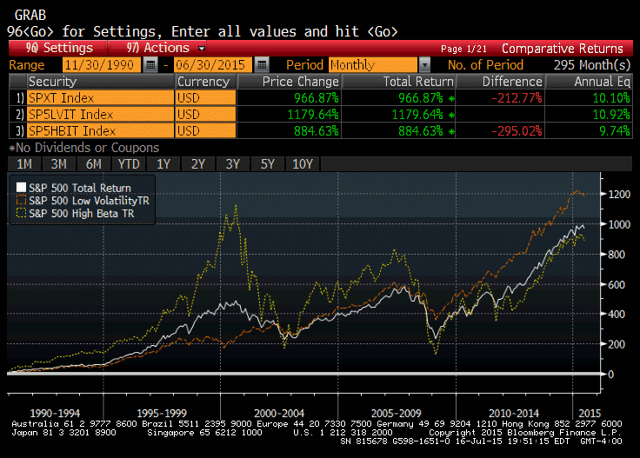
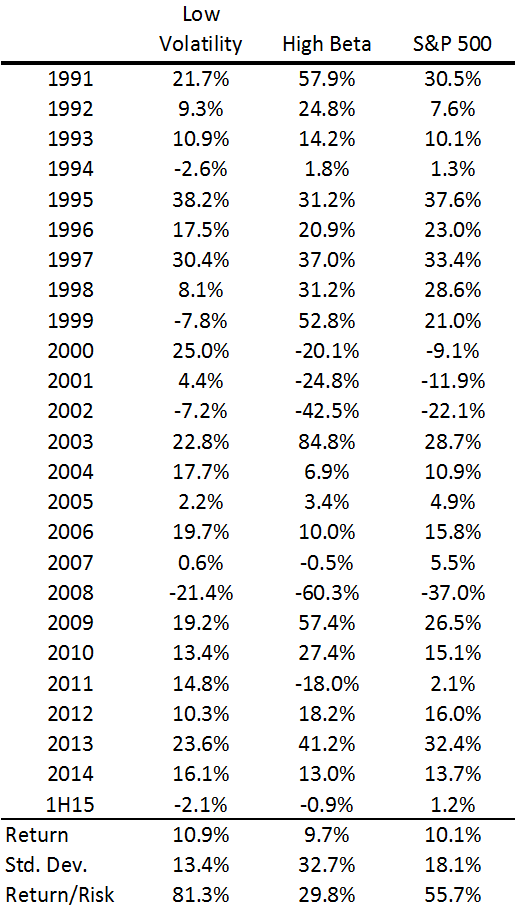 Summary Introduces readers to a series on the Low Volatility Anomaly, or why lower risk investments have outperformed higher risk investments over time. Sets the stage for a more academic approach to detailing Low Volatility strategies. Breaking this thesis down into fundamental pieces could provide for a more consumable narrative for readers and provide an opportunity for real-time feedback as the study is completed. The alpha we are collectively seeking in this community is investment outperformance on a risk-adjusted basis. As a contributor, describing to readers a readily implementable strategy that has consistently and meaningfully outperformed the broader market over the history of modern finance should be a chief goal. I have referenced such a strategy, the Low Volatility Anomaly, in a litany of articles over the years, including in my well received recent series on 5 Ways to Beat the Market . Given the long-run structural alpha generated by low volatility strategies, I want to dedicate a more detailed discussion of the efficacy of this style of investing. Providing a detailed theoretical underpinning of the strategy or detailing multiple examples of its outperformance can prove challenging in a single blog post. In a series of articles, I am going to describe the theoretical underpinning for the Low Volatility Anomaly and empirical evidence of its existence across markets, geographies, and long-time intervals. For most readers, this will not be a summer blockbuster. I am going to attack this series of articles in a more academic approach, linking to scholarly articles by authors who are wiser than me for support of my thesis. By breaking this series into themed segments, I hope it is more consumable for readers wishing to explore the merits of this strategy. I previously had good success with a more long-form academic undertaking through the post, A Lecture on Yield , and I hope readers enjoy this series even more. Before we delve into an introduction on the Low Volatility Anomaly, I want to pictorially demonstrate the strategy. Since pictures are worth a thousand words (and I am preparing to write several thousand of them in this effort), a couple of pictures should be a good place to start. Below is the cumulative total return profile (including reinvested dividends) of the S&P 500 (NYSEARCA: SPY ), the S&P 500 Low Volatility Index (NYSEARCA: SPLV ), and the S&P 500 High Beta Index (NYSEARCA: SPHB ) over the past twenty-five years. The volatility-tilted indices are comprised of the one-hundred lowest (highest) volatility constituents of the S&P 500 based on daily price variability over the trailing one year, rebalanced quarterly, and weighted by inverse (direct) volatility. Pictorial Depiction of the Low Volatility Anomaly (click to enlarge) Below I capture annual total returns of the Low Volatility, High Beta, and broad market indices, and provide summary return and risk statistics, illustrating the risk-adjusted outperformance of Low Volatility stocks. Note: Index data is available back to November 1990. Index data is back-tested based on this methodology, which is hypothetical and not actual performance. While this is not the only example of Low Volatility strategies outperforming their higher beta cohorts or the market in general, it provides a good jumping off point for this discussion based on the broad domestic equity market benchmark. In the graph and chart, one can see that the Low Volatility Index produced higher absolute returns with only three-quarters of the market risk and less than half of the risk of the High Beta Index as measured by variability of returns. We will examine both longer-time interval samples of outperformance and greater alpha in other examples throughout this series, but I hope these historical returns frame the Low Volatility Anomaly at the outset. Why has this anomaly persisted for so long? The next article in this series will begin to discuss the theoretical underpinning for the Low Volatility Anomaly, combining elements of market structure and a touch of behavioral economics. The next section will also feature expansive market studies of the persistence of the Low Volatility Anomaly. Disclaimer My articles may contain statements and projections that are forward-looking in nature, and therefore inherently subject to numerous risks, uncertainties and assumptions. While my articles focus on generating long-term risk-adjusted returns, investment decisions necessarily involve the risk of loss of principal. Individual investor circumstances vary significantly, and information gleaned from my articles should be applied to your own unique investment situation, objectives, risk tolerance, and investment horizon. Disclosure: I am/we are long SPLV, SPY. (More…) I wrote this article myself, and it expresses my own opinions. I am not receiving compensation for it (other than from Seeking Alpha). I have no business relationship with any company whose stock is mentioned in this article. Scalper1 News
Scalper1 News