Tag Archives: nysearcasphb

Revisiting The 100 Stocks With The Lowest Volatility In S&P 500 Index

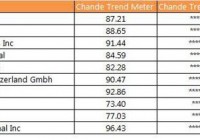
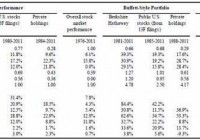
Summary We expand the discussion from a recent Editor’s Pick on building portfolios with the lowest volatility stocks in the S&P 500 Index. We point out that high beta is not necessarily high momentum and discuss why low volatility stocks might provide stronger performance. We simulate the portfolio construction calculations behind the S&P 500 Low Volatility Index and construct the current Top-10 portfolio holdings. We re-rank the lowest volatility stocks by momentum metrics to find stocks trending higher even in the current choppy market conditions. Introduction In a recent Editor’s Pick , Ploutos discussed the relative merits of using low volatility and high beta funds to generate better returns than the SPX (Ref 1). He combined the PowerShares S&P 500 Low Volatility Portfolio (NYSEARCA: SPLV ) and the PowerShares S&P 500 High Beta portfolio (NYSEARCA: SPHB ) to improve returns. His analysis is open to two criticisms. First, he was using a high beta portfolio as a substitute for a momentum strategy. However, high beta does not necessarily mean high momentum. Naturally, these terms are not cast in stone, and differences in calculation methodology and time period of data used in the analysis can change the measured beta as well as calculated momentum. So, for example, a fund like the PowerShares DWA Momentum Portfolio (NYSEARCA: PDP ) could be substituted for the SPHB portfolio. Second, he does not discuss why a stock may have low volatility, why a group of 100 stocks with the lowest volatility had returns greater than the full 500-strong index, and why this outperformance should persist for years on end. Thus, it is theoretically possible to go through a prolonged period during which the 100 stocks with the lowest volatility as a group do not consistently outperform the full index or their high-beta cousins quarter after quarter, and two groups flip flop back and forth negating any benefit of switching from one group to another. Why do stocks have low volatility? There are many reasons a stock could have low volatility. A stock may have low volatility because it has slow earnings growth and does not have the price amplitude, volume and spreads to catch the fancy of short-term traders. The stock may have large institutional ownership, and any dip in the stock leads to greater accumulation by institutions, so that large drops are rare. The earnings could be highly predictable and consistent, so the stock does not produce either positive or negative earnings surprises. The stock could have a large dividend payout, so it trades more like a bond than a stock. The stock could have gone through a period of very high volatility, that has shaken “weak longs” out of the stock, and volatility has diminished as the stock goes through a consolidation. A stock may be viewed as having a conservative management with high cash-flow, slow-growth businesses, that are not sensitive to strength or weakness in the economy. Hence, low volatility could be proxy for slow growth, high cash generators with large institutional ownership that are perceived as “low risk” investments. Thus, the exact reasons that a stock has low volatility over a given period and its implications for price advancement over the immediate future are unclear. Also, there could be numerous other reasons for low volatility in a stock. Why do low volatility stocks outperform the full index? In the ideal scenario, a stock has low volatility, is accumulated, and volatility increases due to favorable developments in the stock, such as improved growth prospects, and the stock breaks out into a strong trend. For example, management could focus on cutting costs and buying other companies with higher-margin products in the same sector. Thus, trading low volatility becomes a counter-trend entry into a stock that will morph into a growth story in the future. In this scenario, this stock starts off as a low volatility entity that shifts gears into a high growth phase, accounting for its outperformance. Of course, it will eventually drop off the 100-lowest volatility list, but then, its substitute will ideally repeat the same pattern. Alternately, the external market environment deteriorates, due to a weak economy or geo-political risks, prospects for price acceleration are murky or confusing, and money comes out of high-beta or high-volatility stocks and rotates into low-volatility stocks, being used as a temporary hedge or defensive position against market worries. These conditions could last for several quarters, and would again account for out-performance versus the full index. Naturally, there could many other possibilities for why low volatility stocks perform better than the index as a whole, such as buy-outs, rising dividends or a prolonged period of very low interest rates. Current State of Play: SPLV ETF As we have discussed above, low volatility does not have to mean low returns, especially when these stocks are used as a bulwark against market uncertainty. We perform a full trend analysis of the top-10 holdings of the PowerShares SPLV ETF (see Figure 1) below. The Top 10 are trending well, with good buying support for CB and BAX in particular. (click to enlarge) Figure 1: The current Top-10 holdings in the SPLV ETF are trending well given all the uncertainty in the market. (Data courtesy ETFmeter.com ) Updated Holdings through August 6 We asked the question: what would the current top 10 look like? We copied the methodology of the index and our updated top-10 holdings are shown in Figure 2. From Figure 1, XL Company (NYSE: XL ) and Stericyle (NASDAQ: SRCL ) are the only two companies in the top 10. One can then argue that an equally weighted portfolio would be better, since the rebalancing would only involve stocks which dropped out of the 100 least volatile stocks group. Figure 2: We update the portfolio weights using data through August 06 and the methodology described by the index provider. Only two of stocks, XL and Stericycle from the current top-10 in the SPLV ETF are on the list. (Data courtesy ETFmeter.com) The Best Trending of the 100 Lowest Volatility Stocks We can now ask the question: which are the best trending of the 100 stocks with the lowest volatility in the S&P 500 index? How are they doing? If money is rotating into low-volatility stocks in the face of market worries, then the 10 best trending stocks out of the 100 stocks with the lowest volatility in the S&P 500 index should be largely defensive stocks with steady earnings. We check this hypothesis in Figure 2 below using data through August, 06 2015. We find that out of the lowest 100 stocks, seventeen stocks seem to be surging, and we show them in Figure 3. The charts are somewhat similar, and we show the charts of Kellogg (NYSE: K ) and Clorox (NYSE: CLX ) to illustrate this idea (see Figures 4 and 5). Figure 3: The 17 stocks with the strongest trends in the 100 stocks with the lowest volatility in the S&P 500 index are a who’s who of defensive stocks. (Data courtesy ETFmeter.com) (click to enlarge) Figure 4: The Kellogg chart is rising strongly during the recent market uncertainty after analyst upgrades. (Chart courtesy StockCharts.com) (click to enlarge) Figure 5: The chart for Clorox looks quite similar to the one in Figure 4, showing the defensive rotation into low volatility stocks. (Chart courtesy StockCharts.com) Summary The low volatility group in the S&P 500 index can offer a respite in the rough seas of a choppy market. There are many alternatives to constructing portfolios with the lowest 100 volatility stocks and combining them with high beta and pure momentum strategies. Disclosure: I/we have no positions in any stocks mentioned, and no plans to initiate any positions within the next 72 hours. (More…) I wrote this article myself, and it expresses my own opinions. I am not receiving compensation for it. I have no business relationship with any company whose stock is mentioned in this article.

Strong Returns In Up Markets; Protection In Down Markets

This series offers an expansive look at the Low Volatility Anomaly, or why lower-risk securities have historically produced stronger risk-adjusted returns than higher-risk securities or the broader market. This article shows in simple terms how a Low Volatility strategy would have done in both up and down markets. The downside protection in bear markets more than makes up for lagging returns in bull markets to generate higher risk-adjusted returns over time. Through this expansive series on Low Volatility Investing, I have tried to give readers a theoretical underpinning for why low volatility strategies have produced “alpha” historically while presenting empirical evidence across markets, geographies, and long time intervals. In this article, I am returning to the example of the S&P 500 Low Volatility Index (replicated by SPLV ). This index is comprised of the one-hundred constituents of the S&P 500 (NYSEARCA: SPY ) with the lowest realized volatility over the trailing one year, weighted by the inverse of their volatility, and rebalanced quarterly. As seen in the introductory article to this series and displayed again below, a low volatility factor tilt has produced higher absolute returns than the broader market or its high beta components (NYSEARCA: SPHB ) while producing its namesake lower volatility return profile. Source: Standard and Poor’s; Bloomberg Index information for the Low Volatility and High Beta Indices are back-tested, based on the methodology that was in effect on the launch date of the indices. While the higher risk-adjusted returns inherent in the Low Volatility strategy is visible in this cumulative return series, I though that it would be instructive for Seeking Alpha readers to see the annual returns of the Low Volatility strategy and S&P 500 broken down by up and down years for the broad market gauge. The historical returns of the two indices are tabled on the left. On the right, I have broken these return series into the four down years for the S&P 500 in this sample period and the up years for this broad market gauge. (click to enlarge) In up years for the broad market, the S&P 500 outperformed the S&P Low Volatility Index by 3.9% per year. However, in the down years for the broad market, the S&P 500 Low Volatility Index bested the broader market by 19.6% per year. It is this outperformance in down markets that has led to the long-run higher absolute returns for the S&P Low Volatility Index. Readers should note that the majority of the outperformance of the S&P 500 in up markets was in 1998 and 1999 when a tech-fueled S&P 500 outperformed the Low Volatility Index. The S&P 500 would produce negative returns over the subsequent three years. Some readers might posit that they will time when to pivot to Low Volatility stocks or even to zero volatility cash from the broader equity market, capturing higher returns during bull markets while crafting their own downside protection through good foresight. For practitioners with a more cloudy crystal ball, low volatility strategies may be a good buy-and-hold strategy for producing higher long-run risk-adjusted returns. In late 2014, I published Low Volatility Strategies in Bull Markets , which showed this Low Volatility gauge had captured all of the market performance over the previous five years. To outperform low volatility stocks, investors would have had to pivot quickly to riskier equity strategies very early in the market recovery in 2009. This is easier said than done, and a buy-and-hold low volatility strategy may be of value to many Seeking Alpha readers. For investors with a higher risk tolerance and an interest in capturing incremental returns from a tilt towards higher beta stocks, read tomorrow’s article on a switching strategy using low volatility stocks and momentum that has produced tremendous long-run alpha and is one of my favorite pieces in this series. Disclaimer My articles may contain statements and projections that are forward-looking in nature, and therefore, inherently subject to numerous risks, uncertainties and assumptions. While my articles focus on generating long-term risk-adjusted returns, investment decisions necessarily involve the risk of loss of principal. Individual investor circumstances vary significantly, and information gleaned from my articles should be applied to your own unique investment situation, objectives, risk tolerance, and investment horizon. Disclosure: I am/we are long SPLV, SPY. (More…) I wrote this article myself, and it expresses my own opinions. I am not receiving compensation for it (other than from Seeking Alpha). I have no business relationship with any company whose stock is mentioned in this article.

Low Volatility Anomaly: Buffett’s Alpha Example

Summary This series offers an expansive look at the Low Volatility Anomaly, or why lower risk stocks have historically produced stronger risk-adjusted returns than higher risk stocks or the broader market. This article offers empirical evidence that one of the most successful investment minds of a generation has capitalized on this anomaly. By adding financial leverage to lower risk businesses, Berkshire Hathaway has generated higher risk-adjusted returns historically. Given the long-run structural alpha generated by low volatility strategies, I wanted to dedicate a more detailed discussion of the efficacy of this style of investing for Seeking Alpha readers. In recent articles, I have provided readers a detailed theoretical underpinning of the strategy. In this article and subsequent pieces, I am going to provide empirical evidence across markets that depicts the success of a low volatility bent. Empirical Evidence of the Low Volatility Anomaly Since the evolution of the Capital Asset Pricing Model (CAPM) in the early 1960s, it has been axiomatic in modern finance that expected returns are a function of an asset’s systematic risk, or beta, when the asset is added to a well-diversified portfolio. As discussed throughout this series thus far, the simplifying assumptions underlying CAPM provide frictions between model and market. These conventions underlying CAPM include that markets are wholly efficient, investors can lend and borrow unlimited amounts at the risk-free rate, trade fee of transaction costs and tax implications, and that the variance of returns is an adequate measure of risk in a world where asset returns are not normally distributed. Despite these shortcomings, the general CAPM framework has largely become broadly embedded in capital budgeting and, in part, market expectations. The presentation of empirical evidence on the Low Volatility Anomaly is greatly strengthened when you can demonstrate its role in the success of one of the greatest investors of our time. In 2013, Andrea Frazzini, David Kabiller, and Lasse Pedersen, each affiliated with hedge fund AQR Capital Management, published ” Buffett’s Alpha “, which deconstructed the return profile of Berkshire Hathaway (NYSE: BRK.A ) (NYSE: BRK.B ). From their analysis, the authors found: “the general tendency of high-quality, safe, and cheap stocks to outperform can explain much of Buffett’s performance and controlling for these factors makes Buffett’s alpha statistically insignificant.” That is a powerful statement. In a set-up to their attention-grabbing assertion, the authors demonstrated that of all stocks that traded for more than 30 years between 1926 and 2011, Berkshire Hathaway had the highest Sharpe Ratio. Buffett also magnified these risk-adjusted excess returns through the deployment of leverage estimated by the authors to be at a level of 1.6 to 1 on average. The leverage came both in the form of borrowings, which benefited from Berkshire Hathaway’s very high quality credit rating, and through float from his insurance subsidiaries. To demonstrate that Buffet’s tremendous performance was a function of this tendency to buy low risk stocks and employ conservative levels of investment leverage, the authors created tracking portfolios to mimic Buffett’s market exposure and active stock-selection themes, leveraged to the same active risk as Berkshire Hathaway. (click to enlarge) The Buffett-tracking portfolio performs comparably to the best-in-class performance of Berkshire Hathaway, demonstrating that Buffett is less a sage stock picker than a principled practitioner who has long understood the Low Volatility Anomaly and who had an investment vehicle that allowed him to avoid costly liquidations in times of stress. Note that Buffett’s average beta of his public stock holdings was just 0.77. In addition to the impressive long-run alpha demonstrated by Buffett’s leveraging of low volatility assets, another glaring failure of CAPM can be seen in the returns of the S&P 500 Low Volatility Index and the S&P 500 High Beta Index. These two indices form portfolios of the one hundred highest and lowest volatility stocks in the S&P 500 Index based on the standard deviation of price changes of the trailing 252 trading days. The indices are then rebalanced quarterly. The performance of these strategies was backtested to 1990, and demonstrates that returns would have been directionally opposite of what would be predicted by CAPM with low volatility stocks (replicated by the PowerShares S&P 500 Low Volatility Portfolio ETF (NYSEARCA: SPLV )) strongly outperforming high beta stocks (replicated by the PowerShares S&P 500 High Beta Portfolio ETF (NYSEARCA: SPHB )). (click to enlarge) Source: Standard and Poor’s; Bloomberg Joining these two examples, Buffett’s recent notable purchases have conformed to the idea of levering low volatility equities. When Berkshire Hathaway and 3G Capital combined to purchase H.J. Heinz in February 2013 , Heinz was the fifteenth largest constituent in the S&P 500 Low Volatility Index, putting the company in the 97th percentile of the S&P 500 in terms of trailing realized volatility. Buffett’s initial investment included an $8B preferred stake with a high fixed coupon, further dampening the volatility of the cash flow returns his enterprise received as part of the deal. The Berkshire/3G Capital combination would further expand their bet on the low beta packaged food sector in March 2015 with the purchase of a controlling stake in Kraft Foods Group (NASDAQ: KHC ). When Berkshire Hathaway’s Mid-American Energy unit purchased NV Energy in June of 2013 , the stock had a trailing twelve month beta of 0.73 and electric utilities were the largest individual sector weighting of the S&P 500 Low Volatility Index. When Berkshire’s utility unit had made an early purchase of Pacificorp in 2006, it was reported in Electric Utility Week that Buffett told Oregon regulators that owning utilities was “not a way to get rich – it’s a way to stay rich.” This quote came in the two years following Texas Pacific’s failed bid for Oregon’s Portland General Electric (NYSE: POR ) and KKR’s nixed acquisition of Arizona’s Unisource ( OTCPK:USRC ). Regulators at the time were concerned that these private equity firms would purchase the utility holding companies with excessive financing, the cost of which could be explicitly borne by customers in the form of higher rates and implicitly through backlogged maintenance, as capital expenditures were crowded out by debt service payments. With the notable exception of the disastrous TXU leveraged buyout in 2007, the industry has largely eschewed large scale leveraging transactions in favor of incremental releveraging through conservatively financed share repurchase plans and above market dividend rates. With regulated returns on equity, utilities generate stable and predictable cash flows for strong operators, making Buffett’s desire to lever the cash flow streams of these companies highly consistent with his long established track record of buying stable businesses. Warren Buffett’s tremendous long-run performance is in large part attributable to his early understanding of the relative outperformance of lower risk and stable businesses. In my next article in this series, I will demonstrate a way to capitalize on the Low Volatility Anomaly in the fixed income market. Disclaimer My articles may contain statements and projections that are forward-looking in nature, and therefore inherently subject to numerous risks, uncertainties and assumptions. While my articles focus on generating long-term risk-adjusted returns, investment decisions necessarily involve the risk of loss of principal. Individual investor circumstances vary significantly, and information gleaned from my articles should be applied to your own unique investment situation, objectives, risk tolerance, and investment horizon. Disclosure: I am/we are long SPLV. (More…) I wrote this article myself, and it expresses my own opinions. I am not receiving compensation for it (other than from Seeking Alpha). I have no business relationship with any company whose stock is mentioned in this article.