Scalper1 News
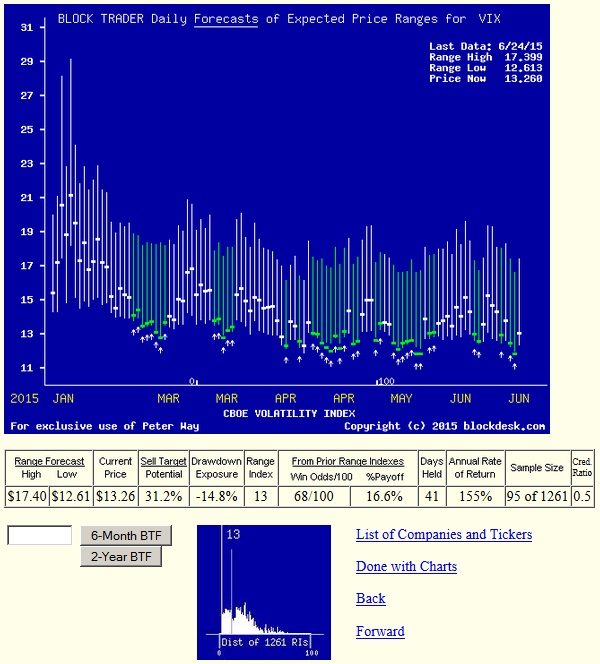
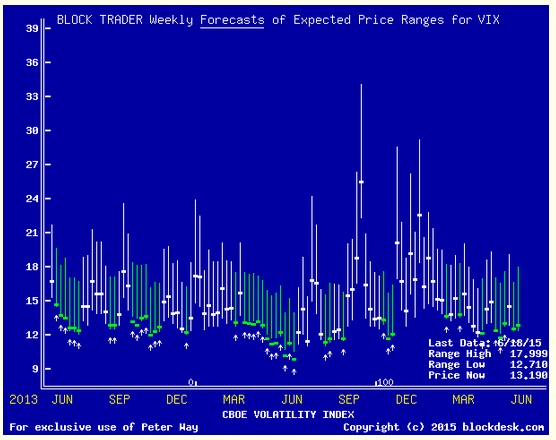
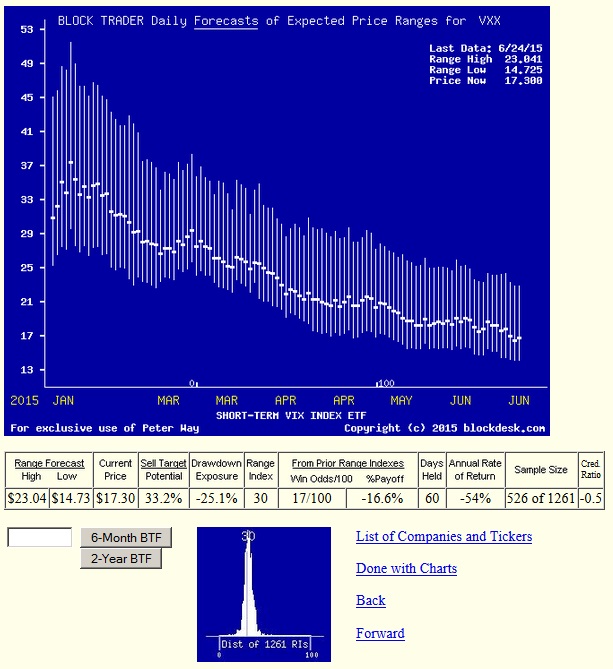
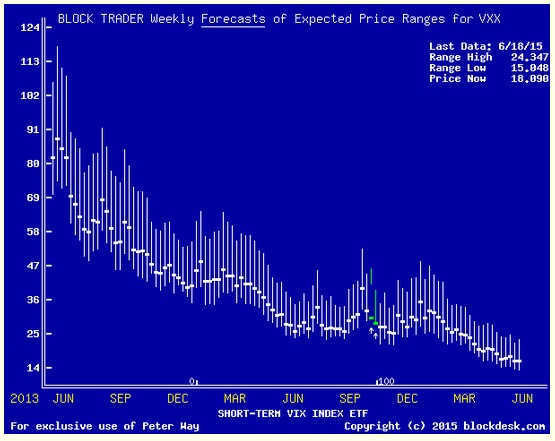
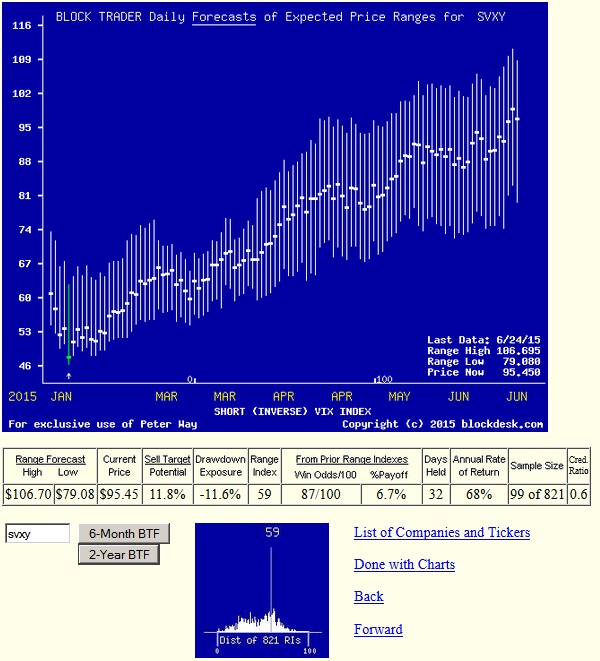
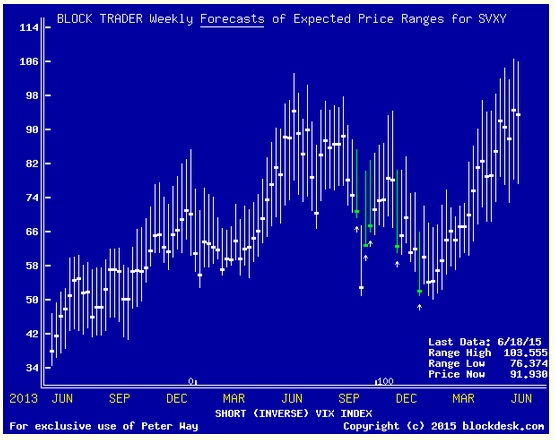 Summary The “fear index” investing/speculating/trading quickly gets submerged into what is for many ordinary investors a morass of arbitrage complexities. So most won’t go near any of the confusing and dangerous ETF products that require constant attention and diddling adjustments. Despite new ETF offerings. Too bad, since assured gains are there from time to time. The trick is in knowing when the time is right to use the tools with adequate market seasoning. Market-makers [MMs] know when. It’s woven into their job. But they are often busy frying much bigger profit fish. Here are simple guidelines for the individual investor to check periodically, any time, any day, for only $25 x 4 a year. The VIXbusters crowd They don’t screw with futures-based ETF products to track and evaluate the VIX INDEX. Contangos, roll yields, backwardation, and margin maintenance are not their things. They deal directly in arbitraging the index itself, hourly or more frequently as necessary, taking the market’s temperature, as preventive maintenance. We check them out at the close, every market day. That tells us what they expect the VIX index can be in the coming near future. Tomorrow, next day, next week. Both upper reaches possible, and lower ones. Sure, you could try to play cute-guy games with untried, unpredictable new ETFs or other more seasoned ones having low credibility and horrible odds of profit success. But there’s no need to take such risks. There are just a few simple things that need to be known. Then the game gets a lot clearer. First, take a look at how the market pros see, and have seen, coming prospects for the VIX Index. Figure 1 (used with permission) The vertical lines of Figure 1 are a visual history of forward-looking expectations of coming prices for the subject ETF. They are NOT a backward-in-time look at actual daily price ranges, but the heavy dot in each range is the ending market quote of the day the forecast was made. What is important in the picture is the balance of upside prospects in comparison to downside concerns. That ratio is expressed in the Range Index [RI], whose number tells what percentage of the whole range lies below the then current price. Today’s Range Index is used to evaluate how well prior forecasts of similar RIs for this ETF have previously worked out. The size of that historic sample is given near the right-hand end of the data line below the picture. The current RI’s size in relation to all available RIs of the past 5 years is indicated in the small blue thumbnail distribution at the bottom of Figure 1. The first items in the data line are current information: The current high and low of the forecast range, and the percent change from the market quote to the top of the range, as a sell target. The Range Index is of the current forecast. Other items of data are all derived from the history of prior forecasts. They stem from applying a T ime- E fficient R isk M anagement D iscipline to hypothetical holdings initiated by the MM forecasts. That discipline requires a next-day closing price cost position be held no longer than 63 market days (3 months) unless first encountered by a market close equal to or above the sell target. The net payoffs are the cumulative average simple percent gains of all such forecast positions, including losses. Days held are average market rather than calendar days held in the sample positions. Drawdown exposure indicates the typical worst-case price experience during those holding periods. Win odds tells what percentage proportion of the sample recovered from the drawdowns to produce a gain. The cred(ibility) ratio compares the sell target prospect with the historic net payoff experiences. Figure 2 provides a longer-time perspective by drawing a once-a week look from the Figure 1 source forecasts, back over (almost) two years. Figure 2 The most important thing to learn from these pictures and this data is that the VIX index is not like most all investable securities. It does not have a growth trend. Its prices do not fluctuate about that trend in any statistical “normal” distribution. MPT and conventional quantitative investment analysis have very little to offer here. VIX Index realities The VIX index is a derivative of other derivatives of the S&P500 index. Our implied price range forecasts from the market-makers are, in turn, a further derivative in a long family chain of such critters. They exist because they have been useful to market pros, far more than to the retail investor or the institutional investor. But like other derivatives, they can’t get used without revealing the expectations of the users. The users operate from a world that is in a narrow balance most of the time, with fluctuations that range in a limited, expected way. For the VIX, its index numbers typically hang around the 15 to 20 level. Their longterm (20-year) average is 20, but is skewed so that 60% are below 20 and 1/3rd are below 15. Its maximum of 80 is so rare that only 1/8th of the time is it above 30. The record low is a hair under 10, and it now is 13, well within, but near the low end of a usual range. The VIX Index goes up when stock prices go down, hence the “fear” label. Here’s the catch But it is very hard to tell in advance when that may happen, by a large enough amount to cause the VIX to rise productively. Past experience from the present MM forecast level has produced (see the row of data under the picture in Figure 1) +16.6% gains on average from the 95 similar forecasts of the last 5 years. But only 68/100 of them were profitable, and they had to recover from typical interim price drawdowns of nearly -15% to do that, or a price swing of over 30%. Not an experience designed to calm the nerves of many retirees. Besides, that “attraction” is largely available only to investment professionals, dealing in more limited circulation markets and securities. In contrast, what the individual investor has had most available is the i Path S&P 500 VIX Short-Term Futures ETN (NYSEARCA: VXX ). It has attracted $1.15 billion of capital and trades 39,164,600 shares a day, sufficient to turn over the entire committed capital in less than 2 days. Not exactly the company of long-term investors, if that is the way you may think of yourself. But such a liquid market might provide some comfort. Let’s see what opportunities the pros have seen there, in comparison to their direct appraisals of the VIX Index in Figures 1 and 2. Figure 3 Figure 4 No, the last 6 months were not an aberration, it is a trend built into the security by its reference to VIX futures instead of the VIX Index as an underlying security. Complex explanations are not needed where pictures make the problem clear. Two other parts of Figures 1 and 3 may also help to enlighten. They are the small blue thumbnail pictures at the bottom of each of those figures that show the distribution of opportunities presented by the forecasts. There are many more, wider opportunities in the VIX distribution than in the narrow, towering cluster of the VXX. VXX provides very little opportunity to anticipate advantageous price change for any but the aggressive day-trader. So how can the individual investor profit from the VIX? The answer is not to try to anticipate a market correction, and thus a rise in the VIX. But instead, to react to one, and profit from the recovery of the market by the VIX’s decline. As is often the case, an ability to do that requires perspective on when to act, using what instrument, and how long to stay committed to a position. The Instrument needed is one that is driven up by a rising market and a declining VIX. There is a related family of such sensitive ETF instruments, led by the P roShares Short VIX Short-Term Futures ETF (NYSEARCA: SVXY ). In support are several leveraged ETFs tracking the S&P500 Index, notably the ProShares UltraPro S&P 500 ETF (NYSEARCA: UPRO ), a 3x ETF tracker, the Direxion Daily S&P 500 Bull 3X Shares ETF (NYSEARCA: SPXL ), and the ProShares Ultra S&P 500 ETF (NYSEARCA: SSO ), a 2X ETF tracker. Figure 5 illustrates SVXY’s appealing price behavior even when markets are only in modest price progress. But Figure 6 should caution that this may not be the time to start or emphasize holdings in SVXY, since we have not yet had the market correction expected by so many VIX advocates. Figure 5 Figure 6 When to act is less of a challenge in anticipating a recovery than in anticipating a correction, but it still is not usually obvious – until after the fact. Conclusion You may do a lot better by calling VIXbusters than VIXbuilders because often market correction worries persist interminably. Time is a valuable resource, made clear by the securities involved here. Our worst recent market correction though, lasted barely 9 months, and until the last couple of them the prevailing focus seemed to be on how much worse it could get. Even missing the first month or two after the turn left another five or so years of upward march, which has pretty much nailed the VIX to its traditional floor. Stay patient. Disclosure: I/we have no positions in any stocks mentioned, and no plans to initiate any positions within the next 72 hours. (More…) I wrote this article myself, and it expresses my own opinions. I am not receiving compensation for it (other than from Seeking Alpha). I have no business relationship with any company whose stock is mentioned in this article. Scalper1 News
Scalper1 News